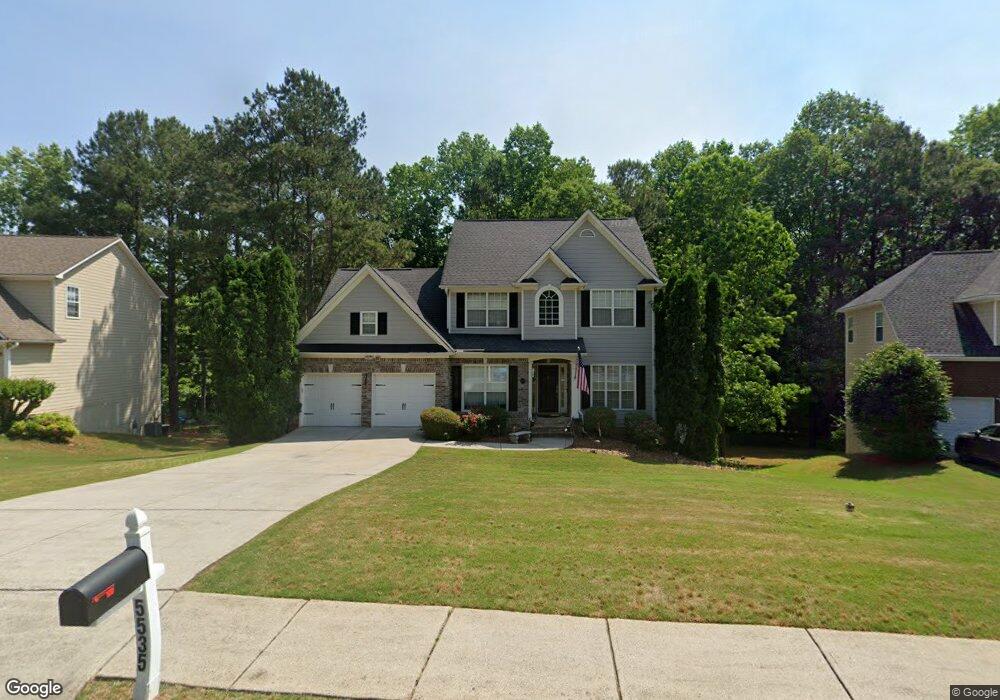
5535 Shepherds Pond Alpharetta, GA 30004
Estimated Value: $595,213 - $632,000
4
Beds
3
Baths
2,371
Sq Ft
$258/Sq Ft
Est. Value
About This Home
This home is located at 5535 Shepherds Pond, Alpharetta, GA 30004 and is currently estimated at $611,053, approximately $257 per square foot. 5535 Shepherds Pond is a home located in Forsyth County with nearby schools including Brandywine Elementary School, DeSana Middle School, and Denmark High School.
Ownership History
Date
Name
Owned For
Owner Type
Purchase Details
Closed on
Jan 31, 2003
Sold by
Eberlein Brett M and Eberlein Kelly M
Bought by
Goodwin John and Goodwin Melissa R
Current Estimated Value
Home Financials for this Owner
Home Financials are based on the most recent Mortgage that was taken out on this home.
Original Mortgage
$214,000
Outstanding Balance
$91,651
Interest Rate
5.95%
Mortgage Type
New Conventional
Estimated Equity
$519,402
Purchase Details
Closed on
Jan 18, 2000
Sold by
Mdc Realty Inc +
Bought by
Eberlein Brett M and Eberlein Kelly M
Home Financials for this Owner
Home Financials are based on the most recent Mortgage that was taken out on this home.
Original Mortgage
$174,900
Interest Rate
8.11%
Mortgage Type
New Conventional
Create a Home Valuation Report for This Property
The Home Valuation Report is an in-depth analysis detailing your home's value as well as a comparison with similar homes in the area
Home Values in the Area
Average Home Value in this Area
Purchase History
| Date | Buyer | Sale Price | Title Company |
|---|---|---|---|
| Goodwin John | $225,700 | -- | |
| Eberlein Brett M | -- | -- | |
| Eberlein Brett M | $205,900 | -- |
Source: Public Records
Mortgage History
| Date | Status | Borrower | Loan Amount |
|---|---|---|---|
| Open | Goodwin John | $214,000 | |
| Previous Owner | Eberlein Brett M | $174,900 |
Source: Public Records
Tax History Compared to Growth
Tax History
| Year | Tax Paid | Tax Assessment Tax Assessment Total Assessment is a certain percentage of the fair market value that is determined by local assessors to be the total taxable value of land and additions on the property. | Land | Improvement |
|---|---|---|---|---|
| 2025 | $4,453 | $242,436 | $68,000 | $174,436 |
| 2024 | $4,453 | $220,836 | $68,000 | $152,836 |
| 2023 | $3,354 | $183,428 | $60,000 | $123,428 |
| 2022 | $3,684 | $136,780 | $40,000 | $96,780 |
| 2021 | $3,337 | $136,780 | $40,000 | $96,780 |
| 2020 | $3,230 | $131,600 | $30,000 | $101,600 |
| 2019 | $3,011 | $120,740 | $30,000 | $90,740 |
| 2018 | $2,924 | $115,880 | $30,000 | $85,880 |
| 2017 | $2,660 | $102,884 | $30,000 | $72,884 |
| 2016 | $2,534 | $96,884 | $24,000 | $72,884 |
| 2015 | $2,496 | $94,884 | $22,000 | $72,884 |
| 2014 | $2,207 | $86,668 | $0 | $0 |
Source: Public Records
Map
Nearby Homes
- 5740 Bryson Ln
- 5750 Bryson Ln
- 5870 Shiloh Woods Dr
- 5430 Breckinridge Ln
- 470 Montgomery Ave
- 6130 Shiloh Woods Dr
- 130 Fowler Hill Rd
- 5025 Montes Ln
- 5075 Montes Ln
- 406 Weatherstone Place
- 4885 Maristone Landing Way
- 4735 Shiloh Valley Rd
- 4905 Shiloh Crossing Way
- 4890 Shiloh Crossing Way
- 1255 Faircrest Crossing Dr
- 4875 Shiloh Crossing Way
- 1650 Township Cir
- 1570 Winshire Cove
- 1615 Waverly Glen Dr
- 310 Big Creek Way
- 5525 Shepherds Pond
- 5545 Shepherds Pond
- 5555 Shepherds Pond
- 5530 Shepherds Pond
- 5550 Shepherds Pond
- 5520 Shepherds Pond
- 5560 Shepherds Pond
- 5565 Shepherds Pond
- 5505 Kennemore Dr
- 5730 Bryson Ln
- 5720 Bryson Ln
- 5610 Shepherds Pond
- 5575 Shepherds Pond
- 5510 Kennemore Dr
- 5515 Kennemore Dr
- 5710 Bryson Ln
- 5585 Shepherds Pond
- 5525 Kennemore Dr
- 5520 Kennemore Dr
- 5725 Bryson Ln