
Seller's Agent in 2020
Kurt Swanson
Windermere Real Estate Whatcom
(360) 920-6555
111 Total Sales
Estimated Value: $615,000 - $701,000
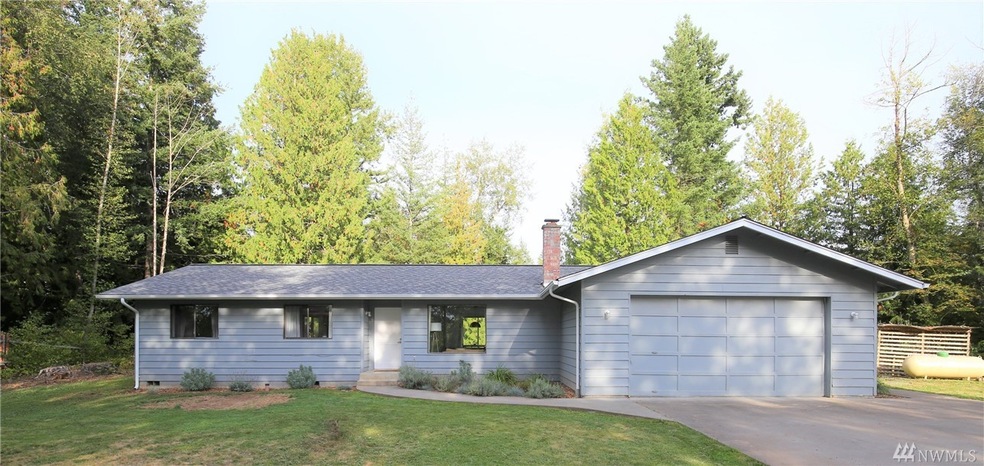
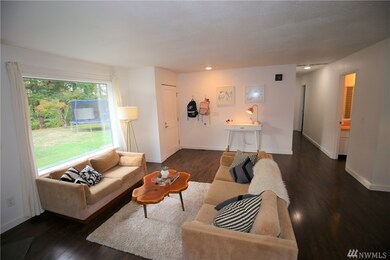
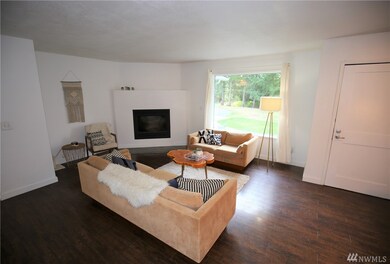
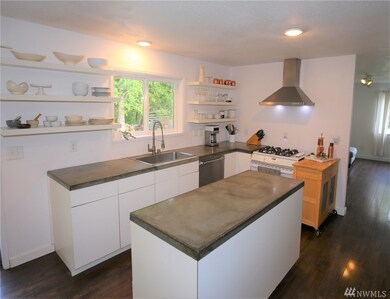
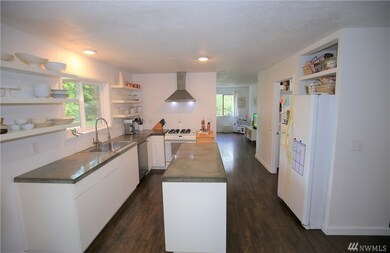
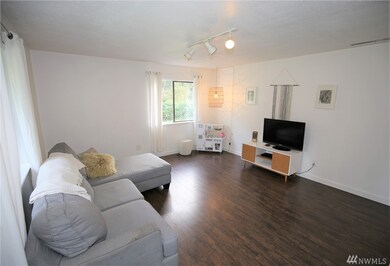
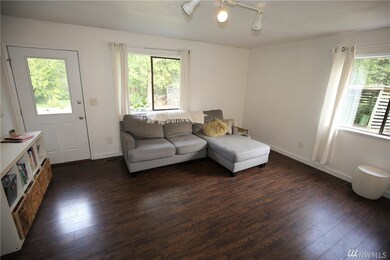
Great Opportunity! Previous buyer couldn't get financing so this great home is back on the market. Nice 3 bed/1.75 bath rambler on 5 private acres close to Bellingham. Home sits back off road & is screened by evergreen trees for privacy. Brand new roof and gutters and other updates have been done including laminate floors, concrete countertops, paint, lighting and more. There is a nice back patio and a fire pit area overlooking a small pond.
Last Agent to Sell the Property
Windermere Real Estate Whatcom License #21247 Listed on: 09/16/2019
Co-Listed By
Brad Howell
Windermere Real Estate Whatcom License #114717
Source: Northwest Multiple Listing Service (NWMLS)
MLS#: NWM1518499
| Date | Buyer | Sale Price | Title Company |
|---|---|---|---|
| Fass Geoff Thomas | $400,000 | Chicago Title Bellingham | |
| Hovde David | $205,280 | Whatcom Land Title | |
| Mallett Mark | $220,000 | Whatcom Land Title | |
| Hoffman David W | $309,438 | Whatcom Land Title |
| Date | Status | Borrower | Loan Amount |
|---|---|---|---|
| Open | Fass Geoff Thomas | $392,755 | |
| Previous Owner | Hovde David | $209,183 | |
| Previous Owner | Mallett Mark | $176,000 | |
| Previous Owner | Hoffman David W | $288,000 |
| Date | Event | Price | List to Sale | Price per Sq Ft | Prior Sale |
|---|---|---|---|---|---|
| 02/10/2020 02/10/20 | Sold | $400,000 | 0.0% | $266 / Sq Ft | |
| 01/18/2020 01/18/20 | Pending | -- | -- | -- | |
| 01/14/2020 01/14/20 | For Sale | $399,900 | 0.0% | $266 / Sq Ft | |
| 11/16/2019 11/16/19 | Pending | -- | -- | -- | |
| 10/23/2019 10/23/19 | Price Changed | $399,900 | -2.5% | $266 / Sq Ft | |
| 09/30/2019 09/30/19 | Price Changed | $410,000 | -2.4% | $273 / Sq Ft | |
| 09/16/2019 09/16/19 | For Sale | $420,000 | +104.9% | $280 / Sq Ft | |
| 07/24/2013 07/24/13 | Sold | $205,000 | 0.0% | $136 / Sq Ft | View Prior Sale |
| 01/15/2013 01/15/13 | Pending | -- | -- | -- | |
| 01/13/2013 01/13/13 | For Sale | $205,000 | -- | $136 / Sq Ft |
| Year | Tax Paid | Tax Assessment Tax Assessment Total Assessment is a certain percentage of the fair market value that is determined by local assessors to be the total taxable value of land and additions on the property. | Land | Improvement |
|---|---|---|---|---|
| 2024 | $4,877 | $552,289 | $278,779 | $273,510 |
| 2023 | $4,877 | $624,421 | $370,558 | $253,863 |
| 2022 | $4,514 | $572,852 | $339,955 | $232,897 |
| 2021 | $4,046 | $447,536 | $265,587 | $181,949 |
| 2020 | $3,556 | $366,830 | $217,693 | $149,137 |
| 2019 | $3,197 | $323,204 | $191,803 | $131,401 |
| 2018 | $3,550 | $317,739 | $188,560 | $129,179 |
| 2017 | $3,153 | $268,387 | $148,912 | $119,475 |
| 2016 | $3,109 | $252,107 | $139,879 | $112,228 |
| 2015 | $3,119 | $247,456 | $137,299 | $110,157 |
| 2014 | -- | $240,874 | $133,647 | $107,227 |
| 2013 | -- | $232,571 | $129,040 | $103,531 |
Seller's Agent in 2020
Kurt Swanson
Windermere Real Estate Whatcom
(360) 920-6555
111 Total Sales
B
Seller Co-Listing Agent in 2020
Brad Howell
Windermere Real Estate Whatcom
Buyer's Agent in 2020
Jacson Bevens
Windermere Real Estate Whatcom
(360) 223-6263
133 Total Sales
Seller's Agent in 2013
Don Oneida
eXp Realty
(360) 920-6304
49 Total Sales
Source: Northwest Multiple Listing Service (NWMLS)
MLS Number: NWM1518499
APN: 390328-038321-0000
Disclaimer: Certain information contained herein is derived from information provided by parties other than Homes.com. All information provided is deemed reliable, but is not guaranteed to be accurate and should be independently verified.
![]() All data is obtained from various sources and may not have been verified by broker or MLS GRID. Supplied Open House Information is subject to change without notice. All information should be independently reviewed and verified for accuracy. Properties may or may not be listed by the office/agent presenting the information. Listing information is provided by the Northwest Multiple Listing Service (NWMLS). Property information is based on available data that may include MLS information, county records, and other sources. Listings marked with the 3 tree icon and provided by NWMLS. All properties are subject to prior sale or withdrawal. IDX information is provided exclusively for consumers’ personal noncommercial use, that it may not be used for any purpose other than to identify prospective properties consumers may be interested in purchasing, that the data is deemed reliable but is not guaranteed by MLS GRID. ©2025 NWMLS.
All data is obtained from various sources and may not have been verified by broker or MLS GRID. Supplied Open House Information is subject to change without notice. All information should be independently reviewed and verified for accuracy. Properties may or may not be listed by the office/agent presenting the information. Listing information is provided by the Northwest Multiple Listing Service (NWMLS). Property information is based on available data that may include MLS information, county records, and other sources. Listings marked with the 3 tree icon and provided by NWMLS. All properties are subject to prior sale or withdrawal. IDX information is provided exclusively for consumers’ personal noncommercial use, that it may not be used for any purpose other than to identify prospective properties consumers may be interested in purchasing, that the data is deemed reliable but is not guaranteed by MLS GRID. ©2025 NWMLS.
Based on information submitted to the MLS GRID