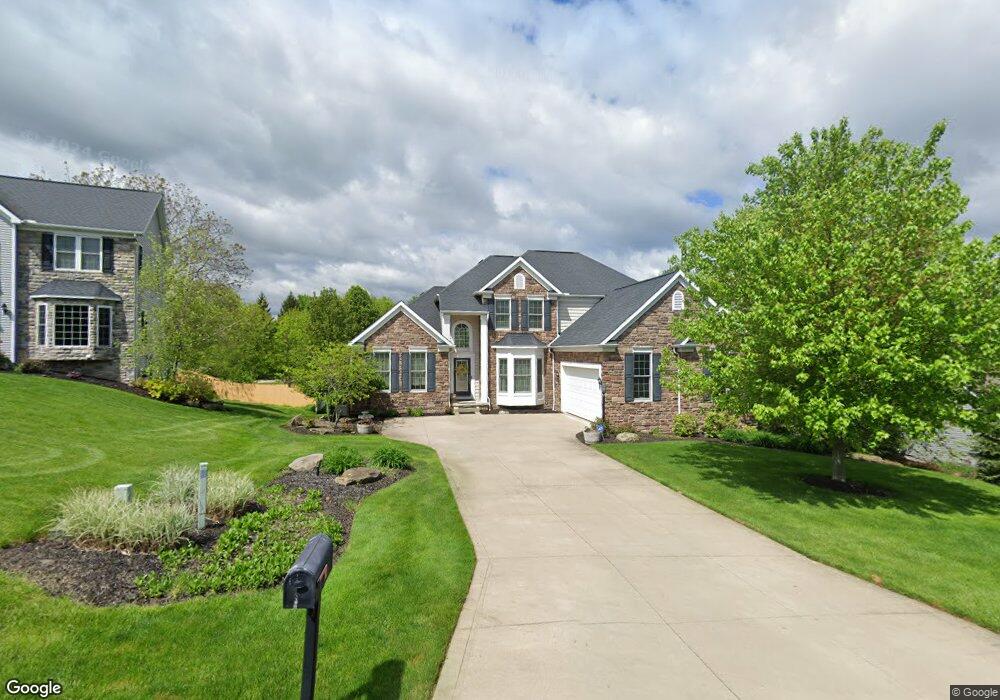
5537 Nettlecreek Ave NW Massillon, OH 44646
Amherst Heights-Clearview NeighborhoodEstimated Value: $528,878 - $607,000
4
Beds
3
Baths
3,240
Sq Ft
$174/Sq Ft
Est. Value
About This Home
This home is located at 5537 Nettlecreek Ave NW, Massillon, OH 44646 and is currently estimated at $563,720, approximately $173 per square foot. 5537 Nettlecreek Ave NW is a home located in Stark County with nearby schools including Sauder Elementary School, Jackson Memorial Middle School, and Jackson High School.
Ownership History
Date
Name
Owned For
Owner Type
Purchase Details
Closed on
Dec 15, 2009
Sold by
Pribble Charles J and Pribble Pamela S
Bought by
Dudley Johnny F and Dudley Judith S
Current Estimated Value
Home Financials for this Owner
Home Financials are based on the most recent Mortgage that was taken out on this home.
Original Mortgage
$276,250
Outstanding Balance
$181,293
Interest Rate
5.02%
Mortgage Type
New Conventional
Estimated Equity
$382,427
Purchase Details
Closed on
Dec 22, 2005
Sold by
Hersh Construction Inc
Bought by
Pribble Charles J and Pribble Pamela S
Home Financials for this Owner
Home Financials are based on the most recent Mortgage that was taken out on this home.
Original Mortgage
$260,000
Interest Rate
5%
Mortgage Type
Fannie Mae Freddie Mac
Purchase Details
Closed on
Jun 2, 2003
Sold by
Ams Llc
Bought by
Hersh Construction Inc
Create a Home Valuation Report for This Property
The Home Valuation Report is an in-depth analysis detailing your home's value as well as a comparison with similar homes in the area
Home Values in the Area
Average Home Value in this Area
Purchase History
| Date | Buyer | Sale Price | Title Company |
|---|---|---|---|
| Dudley Johnny F | $325,000 | Dynamic Title Agency | |
| Pribble Charles J | $325,000 | Revere Title Summit County | |
| Hersh Construction Inc | $108,000 | Midland Commerce Group |
Source: Public Records
Mortgage History
| Date | Status | Borrower | Loan Amount |
|---|---|---|---|
| Open | Dudley Johnny F | $276,250 | |
| Closed | Pribble Charles J | $260,000 |
Source: Public Records
Tax History Compared to Growth
Tax History
| Year | Tax Paid | Tax Assessment Tax Assessment Total Assessment is a certain percentage of the fair market value that is determined by local assessors to be the total taxable value of land and additions on the property. | Land | Improvement |
|---|---|---|---|---|
| 2025 | -- | $158,070 | $39,520 | $118,550 |
| 2024 | -- | $158,070 | $39,520 | $118,550 |
| 2023 | $6,623 | $133,110 | $36,750 | $96,360 |
| 2022 | $3,943 | $133,110 | $36,750 | $96,360 |
| 2021 | $4,105 | $133,110 | $36,750 | $96,360 |
| 2020 | $5,975 | $110,500 | $31,710 | $78,790 |
| 2019 | $1,123 | $110,500 | $31,710 | $78,790 |
| 2018 | $5,784 | $110,500 | $31,710 | $78,790 |
| 2017 | $6,002 | $109,100 | $28,630 | $80,470 |
| 2016 | $5,969 | $107,800 | $28,630 | $79,170 |
| 2015 | $6,043 | $107,800 | $28,630 | $79,170 |
| 2014 | $1,708 | $97,380 | $25,870 | $71,510 |
| 2013 | $2,808 | $97,380 | $25,870 | $71,510 |
Source: Public Records
Map
Nearby Homes
- 8259 Buckingham Cir NW
- 5679 Carters Grove Cir NW
- 5271 Lake Vista Cir NW
- 8309 Gentry St NW
- 8079 Windward Trace Cir NW
- 8555 Esquire St NW
- 8073 Grayson Green St NW
- 8798 Stoneshire St NW
- 6116 Kirknewton Cir NW
- 8325 Condor Cir NW
- 8028 Clifton Court Cir NW
- 5484 High Mill Ave NW
- 5221 Revere Ave NW
- 8322 Forest Ridge St NW
- 5265 Pin Oak Ave NW
- 4792 Revere Ave NW
- 4456 Red Panda Cir NW
- 7750 Killeen St NW
- 8459 Audubon St NW
- 8251 Audubon St NW
- 5555 Nettlecreek Ave NW
- 5525 Nettlecreek Ave NW
- 5507 Nettlecreek Ave NW
- 5548 Nettlecreek Ave NW
- 5520 Nettlecreek Ave NW
- 8423 Fulton Dr NW
- 5591 Nettlecreek Ave NW
- 8451 Fulton Dr NW
- 5500 Nettlecreek Ave NW
- 5586 Nettlecreek Ave NW
- 8339 Buckingham Cir NW
- 8316 Buckingham Cir NW
- 8388 Fulton Dr NW
- 8471 Fulton Dr NW
- 5615 Nettlecreek Ave NW
- 5663 Nettlecreek Ave NW
- 8317 Buckingham Cir NW
- 8242 Buckingham Cir NW
- 8360 Fulton Dr NW
- 8450 Fulton Dr NW