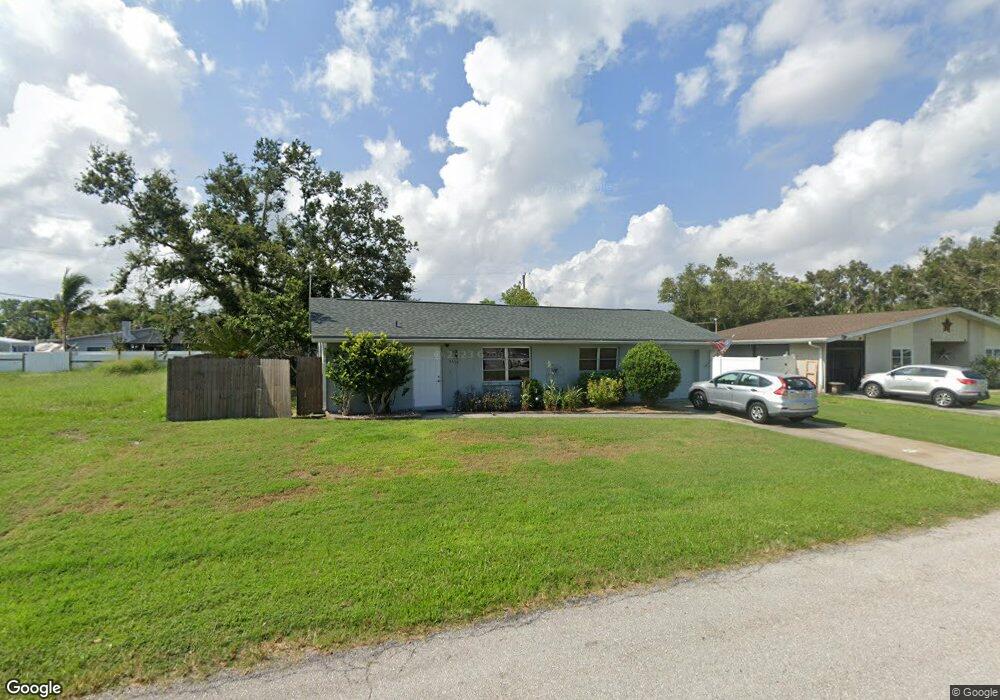
5537 Sailfish Ct Punta Gorda, FL 33982
Estimated Value: $166,000 - $199,000
2
Beds
2
Baths
936
Sq Ft
$193/Sq Ft
Est. Value
About This Home
This home is located at 5537 Sailfish Ct, Punta Gorda, FL 33982 and is currently estimated at $180,871, approximately $193 per square foot. 5537 Sailfish Ct is a home located in Charlotte County with nearby schools including East Elementary School, Punta Gorda Middle School, and Charlotte High School.
Ownership History
Date
Name
Owned For
Owner Type
Purchase Details
Closed on
Oct 12, 1999
Sold by
Buffington Lisa L
Bought by
Buffington Lisa L and Buffington David
Current Estimated Value
Purchase Details
Closed on
Sep 29, 1999
Sold by
Williams Billi A
Bought by
Buffington Lisa L and Buffington David
Purchase Details
Closed on
Sep 9, 1999
Sold by
Williams William S
Bought by
Buffington Lisa L and Buffington David
Purchase Details
Closed on
Sep 8, 1999
Sold by
Guzman Norma J
Bought by
Buffington Lisa L and Buffington David
Purchase Details
Closed on
Sep 4, 1999
Sold by
Williams Eric O
Bought by
Buffington Lisa L and Buffington David
Purchase Details
Closed on
Jun 10, 1998
Sold by
Sedell Joseph M and Sedell Alice S
Bought by
Williams William W
Home Financials for this Owner
Home Financials are based on the most recent Mortgage that was taken out on this home.
Original Mortgage
$51,510
Interest Rate
7.14%
Mortgage Type
VA
Create a Home Valuation Report for This Property
The Home Valuation Report is an in-depth analysis detailing your home's value as well as a comparison with similar homes in the area
Home Values in the Area
Average Home Value in this Area
Purchase History
| Date | Buyer | Sale Price | Title Company |
|---|---|---|---|
| Buffington Lisa L | -- | -- | |
| Buffington Lisa L | -- | -- | |
| Buffington Lisa L | -- | -- | |
| Buffington Lisa L | -- | -- | |
| Buffington Lisa L | -- | -- | |
| Williams William W | $50,500 | -- |
Source: Public Records
Mortgage History
| Date | Status | Borrower | Loan Amount |
|---|---|---|---|
| Previous Owner | Williams William W | $51,510 |
Source: Public Records
Tax History Compared to Growth
Tax History
| Year | Tax Paid | Tax Assessment Tax Assessment Total Assessment is a certain percentage of the fair market value that is determined by local assessors to be the total taxable value of land and additions on the property. | Land | Improvement |
|---|---|---|---|---|
| 2023 | $951 | $42,383 | $0 | $0 |
| 2022 | $891 | $41,149 | $0 | $0 |
| 2021 | $868 | $39,950 | $0 | $0 |
| 2020 | $829 | $39,398 | $0 | $0 |
| 2019 | $753 | $38,512 | $0 | $0 |
| 2018 | $684 | $37,794 | $0 | $0 |
| 2017 | $667 | $37,017 | $0 | $0 |
| 2016 | $650 | $36,256 | $0 | $0 |
| 2015 | $624 | $36,004 | $0 | $0 |
| 2014 | $480 | $35,718 | $0 | $0 |
Source: Public Records
Map
Nearby Homes
- 5527 Fairway Dr S
- 124 Sunset Blvd E
- 730 Sunset Blvd E
- 5311 Papaya Dr Unit 2
- 5311 Papaya Dr
- 6009 George Rd
- 5310 Papaya Dr
- 28111 Bermont Rd
- 239 & 245 Sawfish Ln
- 261 Sawfish Ln
- 5425 Jacaranda Dr
- 829 Sunset Blvd E
- 210 Bonita Ln
- 320 Bonita Ln
- 5231 Jacaranda Dr
- 4901 N Fairway Dr
- 527 Orange Brook Ln
- 811 Yellowtail Ln
- 0000 Yellowtail Lane + Orange Brook
- 331 Yellowtail Ln
- 5529 Sailfish Ct
- 5514 Papaya Dr
- 5504 Papaya Dr
- 5522 Papaya Dr
- 5538 Sailfish Ct
- 5521 Sailfish Ct
- 405 Sailfish Ln
- 5530 Drive
- 5524 Sailfish Ct
- 5438 Papaya Dr
- 335 Sailfish Ln
- 5530 Papaya Dr
- 731 Sailfish Ln
- 811 Sailfish Ln
- 5515 Sailfish Ct
- 5430 Papaya Dr
- 5430 Drive
- 327 Sailfish Ln
- 5501 Fairway Dr S
- 5318 Papaya Dr