J
Landlord's Agent in 2014
Jamille King
Keller Williams River Cities
Estimated Value: $280,000 - $296,000
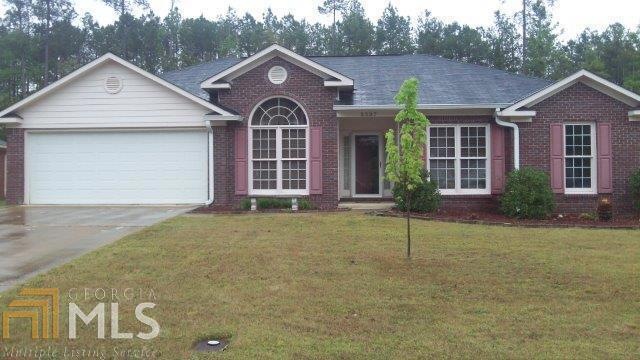
Wonderful Brick 1 story Home Located on a Beautiful cul-de-sac in North Columbus. 4 Bedroom 2 Bath and 2 Car Garage. Greatroom with Fireplace. Kitchen with Breakfast Bar Eat-in area. Laundry room. Split Bedroom Plan. Master Bath with Double Vanities, Garden Tub, Separate Shower. Large Fenced Backyard. Patio.
Last Agent to Rent the Property
Jamille King
Keller Williams River Cities License #183849 Listed on: 04/16/2014

| Date | Buyer | Sale Price | Title Company |
|---|---|---|---|
| Presley Steven D | $176,000 | -- | |
| Smith Kyle E | $200,000 | None Available |
| Date | Status | Borrower | Loan Amount |
|---|---|---|---|
| Open | Presley Steven D | $179,784 | |
| Previous Owner | Smith Kyle E | $198,431 |
| Date | Event | Price | List to Sale | Price per Sq Ft |
|---|---|---|---|---|
| 05/20/2014 05/20/14 | Rented | $1,350 | 0.0% | -- |
| 05/01/2014 05/01/14 | For Rent | $1,350 | 0.0% | -- |
| 05/01/2014 05/01/14 | Rented | $1,350 | 0.0% | -- |
| 04/20/2014 04/20/14 | Under Contract | -- | -- | -- |
| 04/16/2014 04/16/14 | For Rent | $1,350 | -- | -- |
| Year | Tax Paid | Tax Assessment Tax Assessment Total Assessment is a certain percentage of the fair market value that is determined by local assessors to be the total taxable value of land and additions on the property. | Land | Improvement |
|---|---|---|---|---|
| 2025 | $2,240 | $97,580 | $13,216 | $84,364 |
| 2024 | $2,239 | $95,576 | $13,216 | $82,360 |
| 2023 | $1,558 | $95,576 | $13,216 | $82,360 |
| 2022 | $2,334 | $76,520 | $13,216 | $63,304 |
| 2021 | $2,328 | $66,792 | $13,216 | $53,576 |
| 2020 | $2,328 | $66,792 | $13,216 | $53,576 |
| 2019 | $2,338 | $66,792 | $13,216 | $53,576 |
| 2018 | $2,338 | $66,792 | $13,216 | $53,576 |
| 2017 | $2,347 | $66,792 | $13,216 | $53,576 |
| 2016 | $2,357 | $70,400 | $12,800 | $57,600 |
| 2015 | $2,360 | $70,400 | $12,800 | $57,600 |
| 2014 | $1,104 | $80,000 | $12,800 | $67,200 |
| 2013 | -- | $80,000 | $12,800 | $67,200 |
J
Landlord's Agent in 2014
Jamille King
Keller Williams River Cities
Tenant's Agent in 2014
Glenda Broker
Non-Mls Company
(800) 289-1214
Source: Georgia MLS
MLS Number: 7262236
APN: 081-043-020
Disclaimer: Certain information contained herein is derived from information provided by parties other than Homes.com. All information provided is deemed reliable, but is not guaranteed to be accurate and should be independently verified.
![]() The data relating to real estate for sale on this web site comes in part from the Broker Reciprocity Program of Georgia MLS. Real estate listings held by brokerage firms other than Redfin are marked with the Broker Reciprocity logo and detailed information about them includes the name of the listing brokers. Information deemed reliable but not guaranteed. Copyright 2025 Georgia MLS. All rights reserved.
The data relating to real estate for sale on this web site comes in part from the Broker Reciprocity Program of Georgia MLS. Real estate listings held by brokerage firms other than Redfin are marked with the Broker Reciprocity logo and detailed information about them includes the name of the listing brokers. Information deemed reliable but not guaranteed. Copyright 2025 Georgia MLS. All rights reserved.