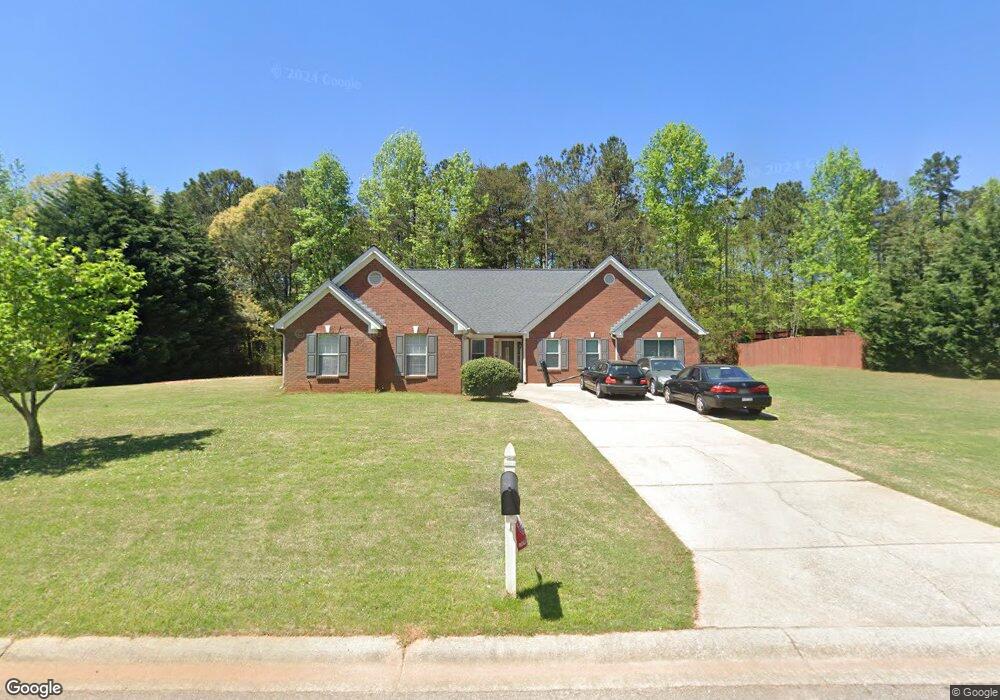
5538 Rose Ridge Ct Flowery Branch, GA 30542
Estimated Value: $403,000 - $432,000
3
Beds
2
Baths
2,405
Sq Ft
$173/Sq Ft
Est. Value
About This Home
This home is located at 5538 Rose Ridge Ct, Flowery Branch, GA 30542 and is currently estimated at $415,753, approximately $172 per square foot. 5538 Rose Ridge Ct is a home located in Hall County with nearby schools including Friendship Elementary School, C.W. Davis Middle School, and Flowery Branch High School.
Ownership History
Date
Name
Owned For
Owner Type
Purchase Details
Closed on
Nov 4, 2019
Sold by
Hylton Desmond Nathaniel
Bought by
Hylton Desmond Nathaniel and Hylton Sharon Denise
Current Estimated Value
Purchase Details
Closed on
Mar 4, 2005
Sold by
Hylton Desmond Nathaniel
Bought by
Hylton Desmond
Purchase Details
Closed on
Mar 29, 2001
Sold by
Appco Enterprises Inc
Bought by
Hylton Desmond Nathaniel
Home Financials for this Owner
Home Financials are based on the most recent Mortgage that was taken out on this home.
Original Mortgage
$156,978
Interest Rate
7.11%
Mortgage Type
VA
Purchase Details
Closed on
Nov 9, 1999
Sold by
Breedlove Toby
Bought by
Breedlove Toby
Home Financials for this Owner
Home Financials are based on the most recent Mortgage that was taken out on this home.
Original Mortgage
$110,175
Interest Rate
9.2%
Mortgage Type
New Conventional
Purchase Details
Closed on
Nov 8, 1999
Sold by
R & M Developers Inc
Bought by
Breedlove Toby
Home Financials for this Owner
Home Financials are based on the most recent Mortgage that was taken out on this home.
Original Mortgage
$110,175
Interest Rate
9.2%
Mortgage Type
New Conventional
Create a Home Valuation Report for This Property
The Home Valuation Report is an in-depth analysis detailing your home's value as well as a comparison with similar homes in the area
Home Values in the Area
Average Home Value in this Area
Purchase History
| Date | Buyer | Sale Price | Title Company |
|---|---|---|---|
| Hylton Desmond Nathaniel | -- | -- | |
| Hylton Desmond | -- | -- | |
| Hylton Desmond Nathaniel | $153,900 | -- | |
| Breedlove Toby | $540,000 | -- | |
| Breedlove Toby | $2,106,000 | -- |
Source: Public Records
Mortgage History
| Date | Status | Borrower | Loan Amount |
|---|---|---|---|
| Previous Owner | Hylton Desmond Nathaniel | $156,978 | |
| Previous Owner | Breedlove Toby | $110,175 |
Source: Public Records
Tax History Compared to Growth
Tax History
| Year | Tax Paid | Tax Assessment Tax Assessment Total Assessment is a certain percentage of the fair market value that is determined by local assessors to be the total taxable value of land and additions on the property. | Land | Improvement |
|---|---|---|---|---|
| 2024 | $394 | $157,736 | $30,600 | $127,136 |
| 2023 | $268 | $148,176 | $30,600 | $117,576 |
| 2022 | $316 | $130,256 | $30,600 | $99,656 |
| 2021 | $103 | $104,656 | $16,320 | $88,336 |
| 2020 | $68 | $86,536 | $8,640 | $77,896 |
| 2019 | $67 | $81,216 | $8,640 | $72,576 |
| 2018 | $866 | $76,736 | $8,640 | $68,096 |
| 2017 | $784 | $72,856 | $8,640 | $64,216 |
| 2016 | $549 | $53,006 | $8,640 | $44,366 |
| 2015 | $998 | $53,006 | $8,640 | $44,366 |
| 2014 | $998 | $53,006 | $8,640 | $44,366 |
Source: Public Records
Map
Nearby Homes
- 5532 Rose Ridge Ct
- 5544 Rose Ridge Ct
- 5526 Rose Ridge Ct
- 5545 Rose Ridge Ct
- 5550 Rose Ridge Ct
- 5539 Rose Ridge Ct
- 5551 Rose Ridge Ct
- 5527 Rose Ridge Ct
- 0 Rose Ridge Ct Unit 7236714
- 0 Rose Ridge Ct Unit 3282262
- 0 Rose Ridge Ct Unit 3237105
- 0 Rose Ridge Ct Unit 3143320
- 0 Rose Ridge Ct Unit 8890254
- 0 Rose Ridge Ct Unit 8059452
- 5557 Rose Ridge Ct
- 5520 Rose Ridge Ct
- 5556 Rose Ridge Ct
- 5563 Rose Ridge Ct
- 5514 Rose Ridge Ct
- 5511 Rose Ridge Ct