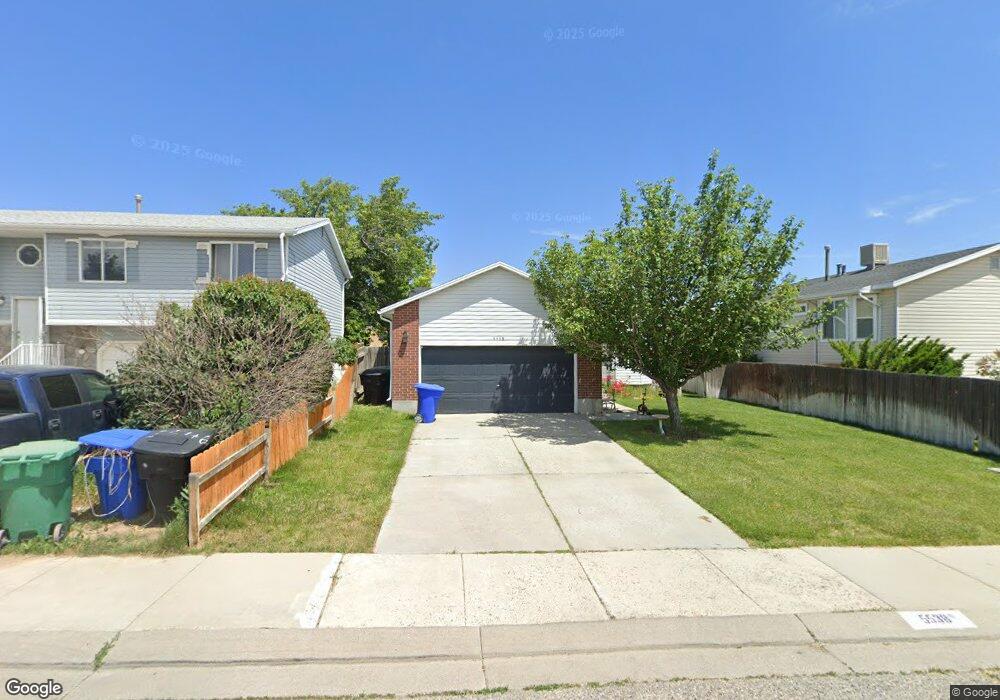
5538 Shadberry Cir West Jordan, UT 84081
Oquirrh NeighborhoodEstimated Value: $458,000 - $513,000
3
Beds
1
Bath
2,112
Sq Ft
$228/Sq Ft
Est. Value
About This Home
This home is located at 5538 Shadberry Cir, West Jordan, UT 84081 and is currently estimated at $480,711, approximately $227 per square foot. 5538 Shadberry Cir is a home located in Salt Lake County with nearby schools including Mountain Shadows School, West Hills Middle School, and Copper Hills High School.
Ownership History
Date
Name
Owned For
Owner Type
Purchase Details
Closed on
May 11, 2018
Sold by
Omer Robert and Omer Natalle
Bought by
Swartz Charles J and Swartz Sandy
Current Estimated Value
Home Financials for this Owner
Home Financials are based on the most recent Mortgage that was taken out on this home.
Original Mortgage
$279,837
Outstanding Balance
$242,860
Interest Rate
4.75%
Mortgage Type
FHA
Estimated Equity
$237,851
Purchase Details
Closed on
May 25, 2000
Sold by
Pugh Michael W and Pugh Linda G
Bought by
Omer Robert and Omer Natalie
Home Financials for this Owner
Home Financials are based on the most recent Mortgage that was taken out on this home.
Original Mortgage
$123,190
Interest Rate
8.08%
Purchase Details
Closed on
Feb 18, 1994
Sold by
Reliance Homes Inc
Bought by
Pugh Michael W and Pugh Linda G
Home Financials for this Owner
Home Financials are based on the most recent Mortgage that was taken out on this home.
Original Mortgage
$81,061
Interest Rate
6.98%
Mortgage Type
FHA
Create a Home Valuation Report for This Property
The Home Valuation Report is an in-depth analysis detailing your home's value as well as a comparison with similar homes in the area
Home Values in the Area
Average Home Value in this Area
Purchase History
| Date | Buyer | Sale Price | Title Company |
|---|---|---|---|
| Swartz Charles J | -- | First American Title | |
| Omer Robert | -- | Merrill Title | |
| Pugh Michael W | -- | -- |
Source: Public Records
Mortgage History
| Date | Status | Borrower | Loan Amount |
|---|---|---|---|
| Open | Swartz Charles J | $279,837 | |
| Previous Owner | Omer Robert | $123,190 | |
| Previous Owner | Pugh Michael W | $81,061 |
Source: Public Records
Tax History Compared to Growth
Tax History
| Year | Tax Paid | Tax Assessment Tax Assessment Total Assessment is a certain percentage of the fair market value that is determined by local assessors to be the total taxable value of land and additions on the property. | Land | Improvement |
|---|---|---|---|---|
| 2025 | $2,517 | $450,800 | $95,400 | $355,400 |
| 2024 | $2,517 | $425,500 | $90,000 | $335,500 |
| 2023 | $2,507 | $398,200 | $86,500 | $311,700 |
| 2022 | $2,564 | $404,800 | $84,800 | $320,000 |
| 2021 | $2,243 | $328,800 | $65,200 | $263,600 |
| 2020 | $2,084 | $285,300 | $65,200 | $220,100 |
| 2019 | $2,039 | $273,000 | $61,600 | $211,400 |
| 2018 | $1,722 | $227,500 | $61,600 | $165,900 |
| 2017 | $1,693 | $220,400 | $61,600 | $158,800 |
| 2016 | $1,605 | $196,600 | $61,600 | $135,000 |
| 2015 | $1,400 | $165,400 | $58,900 | $106,500 |
| 2014 | $1,367 | $158,700 | $57,100 | $101,600 |
Source: Public Records
Map
Nearby Homes
- 5579 W Lopalena Cir
- 5581 Bluevail Ct
- 6922 Mullien Dr
- 5466 Ticklegrass Rd
- 7758 S Iron Core Ln
- 7146 W Owens View Way Unit 204
- 7259 W Cibola Rd
- 6853 Mullien Dr Unit 5420
- 5557 W Joshua Cir
- 6739 S Sol Rise Dr
- 6839 S Cyclamen Dr
- 6721 Adventure Way
- 7043 S Orion Hill Rd
- 7043 Orion Hill Rd
- 5732 W Moon Crest Ct
- 7134 S Rialto Way
- 5281 Saguaro Dr
- 6698 Early Dawn Dr
- 7113 S Mantova Way
- 5208 W Case Mountain Rd
- 5538 W Shadberry Cir
- 5546 Shadberry Cir
- 5546 W Shadberry Cir
- 6874 Lotus Way
- 6858 Lotus Way
- 6858 S Lotus Way
- 5547 Ticklegrass Rd
- 5558 Shadberry Cir
- 5547 W Ticklegrass Rd
- 5558 W Shadberry Cir
- 5555 Ticklegrass Rd
- 5555 W Ticklegrass Rd
- 5541 W Shadberry Cir
- 5541 Shadberry Cir
- 5533 W Shadberry Cir
- 5533 Shadberry Cir
- 5570 W Shadberry Cir
- 5549 W Shadberry Cir
- 5570 Shadberry Cir
- 5549 Shadberry Cir