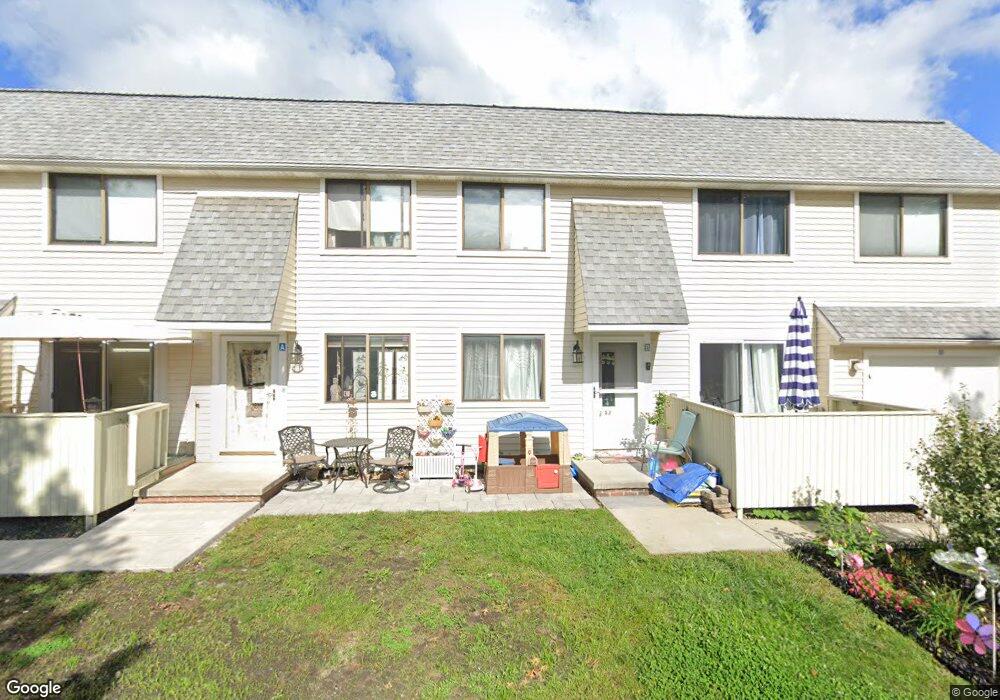
5538 Sutton Ln Unit D21 Willoughby, OH 44094
Downtown Willoughby NeighborhoodEstimated Value: $136,000 - $160,000
2
Beds
1
Bath
952
Sq Ft
$157/Sq Ft
Est. Value
About This Home
This home is located at 5538 Sutton Ln Unit D21, Willoughby, OH 44094 and is currently estimated at $149,182, approximately $156 per square foot. 5538 Sutton Ln Unit D21 is a home located in Lake County with nearby schools including Edison Elementary School, Willoughby Middle School, and South High School.
Ownership History
Date
Name
Owned For
Owner Type
Purchase Details
Closed on
May 30, 2019
Sold by
Metcalf Thomas M
Bought by
Lazar Kathleen J
Current Estimated Value
Home Financials for this Owner
Home Financials are based on the most recent Mortgage that was taken out on this home.
Original Mortgage
$95,000
Outstanding Balance
$82,830
Interest Rate
4.1%
Mortgage Type
New Conventional
Estimated Equity
$66,352
Purchase Details
Closed on
Oct 15, 1999
Sold by
Mako Thomas C and Mako Deena M
Bought by
Metcalf Thomas M
Home Financials for this Owner
Home Financials are based on the most recent Mortgage that was taken out on this home.
Original Mortgage
$55,000
Interest Rate
7.91%
Purchase Details
Closed on
Jul 3, 1996
Sold by
Lucile E Laganke Est
Bought by
Mako Thomas C and Mako Deena
Home Financials for this Owner
Home Financials are based on the most recent Mortgage that was taken out on this home.
Original Mortgage
$65,075
Interest Rate
8.07%
Mortgage Type
New Conventional
Create a Home Valuation Report for This Property
The Home Valuation Report is an in-depth analysis detailing your home's value as well as a comparison with similar homes in the area
Home Values in the Area
Average Home Value in this Area
Purchase History
| Date | Buyer | Sale Price | Title Company |
|---|---|---|---|
| Lazar Kathleen J | $70,500 | Ohio Real Title | |
| Metcalf Thomas M | $104,000 | Midland Title Security Inc | |
| Mako Thomas C | $68,500 | -- |
Source: Public Records
Mortgage History
| Date | Status | Borrower | Loan Amount |
|---|---|---|---|
| Open | Lazar Kathleen J | $95,000 | |
| Previous Owner | Metcalf Thomas M | $55,000 | |
| Previous Owner | Mako Thomas C | $65,075 |
Source: Public Records
Tax History
| Year | Tax Paid | Tax Assessment Tax Assessment Total Assessment is a certain percentage of the fair market value that is determined by local assessors to be the total taxable value of land and additions on the property. | Land | Improvement |
|---|---|---|---|---|
| 2025 | -- | $41,350 | $13,860 | $27,490 |
| 2024 | -- | $41,350 | $13,860 | $27,490 |
| 2023 | $3,150 | $33,270 | $11,740 | $21,530 |
| 2022 | $1,541 | $33,270 | $11,740 | $21,530 |
| 2021 | $1,546 | $33,270 | $11,740 | $21,530 |
| 2020 | $1,320 | $27,280 | $9,630 | $17,650 |
| 2019 | $1,227 | $27,280 | $9,630 | $17,650 |
| 2018 | $1,125 | $23,670 | $6,620 | $17,050 |
| 2017 | $1,043 | $23,670 | $6,620 | $17,050 |
| 2016 | $1,038 | $23,670 | $6,620 | $17,050 |
| 2015 | $970 | $23,670 | $6,620 | $17,050 |
| 2014 | $921 | $23,670 | $6,620 | $17,050 |
| 2013 | $922 | $23,670 | $6,620 | $17,050 |
Source: Public Records
Map
Nearby Homes
- 5520 Bretton Ct Unit A
- 5551 Ivy Ct
- 34840 Aspen Wood Ln
- 35005 Lisle Ct
- 1653 Douglas Rd
- 1677 Mapledale Rd
- 35362 Bald Eagle Ln
- 1648 Douglas Rd
- 34615 Ethan Way
- 1624 Douglas Rd
- 5218 Liberty Ln Unit A
- 5095 Shepherds Glen
- 5093 Shepherds Glen
- 5091 Shepherds Glen
- 5089 Shepherds Glen
- 5085 Shepherds Glen
- 5083 Shepherds Glen
- 5081 Shepherds Glen
- 0 Som Center Rd Unit 5164422
- 5084 Shepherds Glen
- 5538 Sutton Ln Unit C21
- 5538 Sutton Ln Unit B21
- 5538 Sutton Ln Unit A21
- 5538 Sutton Ln Unit 21-D
- 5539 Sutton Ln Unit D15
- 5539 Sutton Ln Unit C15
- 5539 Sutton Ln Unit B15
- 5539 Sutton Ln Unit A15
- 5539 Sutton Ln Unit 15 A
- 5539 Sutton Ln Unit B
- 5518 Sutton Ln Unit D20
- 5518 Sutton Ln Unit C20
- 5518 Sutton Ln Unit B20
- 5518 Sutton Ln Unit A20
- 5518 Sutton Ln
- 5518 Sutton Ln Unit D
- 5518 Sutton Ln Unit 20-D
- 5518 Sutton Ln Unit 20-B
- 5524 Wrens Ln Unit D28
- 5524 Wrens Ln Unit C28