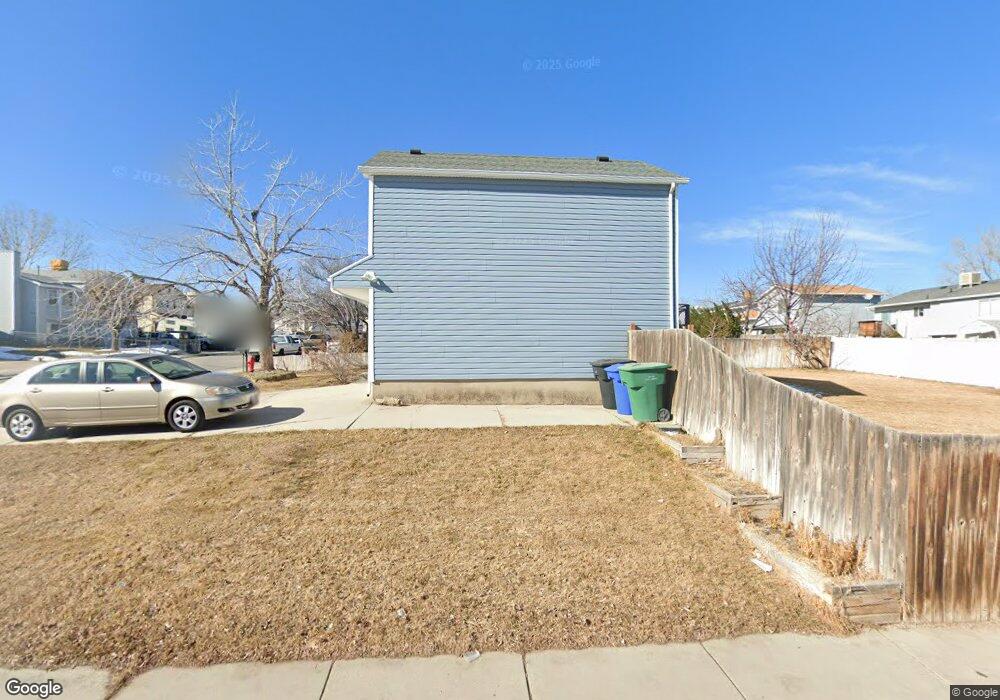
5538 W Deerbrush Cir West Jordan, UT 84081
Oquirrh NeighborhoodEstimated Value: $400,000 - $457,000
3
Beds
2
Baths
1,312
Sq Ft
$330/Sq Ft
Est. Value
About This Home
This home is located at 5538 W Deerbrush Cir, West Jordan, UT 84081 and is currently estimated at $433,567, approximately $330 per square foot. 5538 W Deerbrush Cir is a home located in Salt Lake County with nearby schools including Mountain Shadows School, West Hills Middle School, and Copper Hills High School.
Ownership History
Date
Name
Owned For
Owner Type
Purchase Details
Closed on
Apr 26, 2010
Sold by
Hare Matt T and Hare Sarah J
Bought by
Busath Andrew N and Busath Aleshea D
Current Estimated Value
Home Financials for this Owner
Home Financials are based on the most recent Mortgage that was taken out on this home.
Original Mortgage
$168,393
Outstanding Balance
$113,253
Interest Rate
5.12%
Mortgage Type
FHA
Estimated Equity
$320,314
Purchase Details
Closed on
Dec 26, 2008
Sold by
Hare Matt T and Hare Sarah J K
Bought by
Hare Matt T and Hare Sarah J
Home Financials for this Owner
Home Financials are based on the most recent Mortgage that was taken out on this home.
Original Mortgage
$141,400
Interest Rate
6.03%
Mortgage Type
New Conventional
Purchase Details
Closed on
Mar 16, 2004
Sold by
King Mitchell C and King Catherine L
Bought by
Hare Matt T and Hare Sarah J K
Home Financials for this Owner
Home Financials are based on the most recent Mortgage that was taken out on this home.
Original Mortgage
$126,022
Interest Rate
5.69%
Mortgage Type
FHA
Create a Home Valuation Report for This Property
The Home Valuation Report is an in-depth analysis detailing your home's value as well as a comparison with similar homes in the area
Home Values in the Area
Average Home Value in this Area
Purchase History
| Date | Buyer | Sale Price | Title Company |
|---|---|---|---|
| Busath Andrew N | -- | Bonneville Superior Title | |
| Hare Matt T | -- | Title One | |
| Hare Matt T | -- | Backman Stewart Title Svcs |
Source: Public Records
Mortgage History
| Date | Status | Borrower | Loan Amount |
|---|---|---|---|
| Open | Busath Andrew N | $168,393 | |
| Previous Owner | Hare Matt T | $141,400 | |
| Previous Owner | Hare Matt T | $126,022 | |
| Closed | Hare Matt T | $5,040 |
Source: Public Records
Tax History Compared to Growth
Tax History
| Year | Tax Paid | Tax Assessment Tax Assessment Total Assessment is a certain percentage of the fair market value that is determined by local assessors to be the total taxable value of land and additions on the property. | Land | Improvement |
|---|---|---|---|---|
| 2025 | $2,398 | $430,500 | $110,000 | $320,500 |
| 2024 | $2,398 | $405,300 | $103,700 | $301,600 |
| 2023 | $2,393 | $380,100 | $99,700 | $280,400 |
| 2022 | $2,285 | $360,700 | $97,800 | $262,900 |
| 2021 | $2,008 | $294,300 | $75,200 | $219,100 |
| 2020 | $1,869 | $255,800 | $75,200 | $180,600 |
| 2019 | $1,821 | $243,800 | $71,000 | $172,800 |
| 2018 | $1,701 | $224,700 | $71,000 | $153,700 |
| 2017 | $1,569 | $204,300 | $71,000 | $133,300 |
| 2016 | $1,511 | $185,000 | $71,000 | $114,000 |
| 2015 | $1,385 | $163,600 | $68,000 | $95,600 |
| 2014 | $1,358 | $157,600 | $65,900 | $91,700 |
Source: Public Records
Map
Nearby Homes
- 5581 Bluevail Ct
- 5557 W Joshua Cir
- 5466 Ticklegrass Rd
- 6739 S Sol Rise Dr
- 6922 Mullien Dr
- 5579 W Lopalena Cir
- 6721 Adventure Way
- 6853 Mullien Dr Unit 5420
- 7758 S Iron Core Ln
- 7146 W Owens View Way Unit 204
- 7259 W Cibola Rd
- 6839 S Cyclamen Dr
- 5732 W Moon Crest Ct
- 6698 Early Dawn Dr
- 5281 Saguaro Dr
- 7043 S Orion Hill Rd
- 7043 Orion Hill Rd
- 6489 S Daffodil Way
- 7134 S Rialto Way
- 7113 S Mantova Way
- 5538 Deerbrush Cir
- 5546 Deerbrush Cir
- 6780 W 6780 S
- 5537 Saguaro Dr
- 5554 Deerbrush Cir
- 5554 W Deerbrush Cir
- 5545 Saguaro Dr
- 5545 W Saguaro Dr
- 5520 Aristada Ave
- 5553 Saguaro Dr
- 5553 W Saguaro Dr
- 5539 W Deerbrush Cir
- 6751 S Lotus Way
- 5539 Deerbrush Cir
- 6751 Lotus Way
- 5564 W Deerbrush Cir
- 5547 W Deerbrush Cir
- 5547 Deerbrush Cir
- 5512 W Aristada Ave
- 5564 Deerbrush Cir