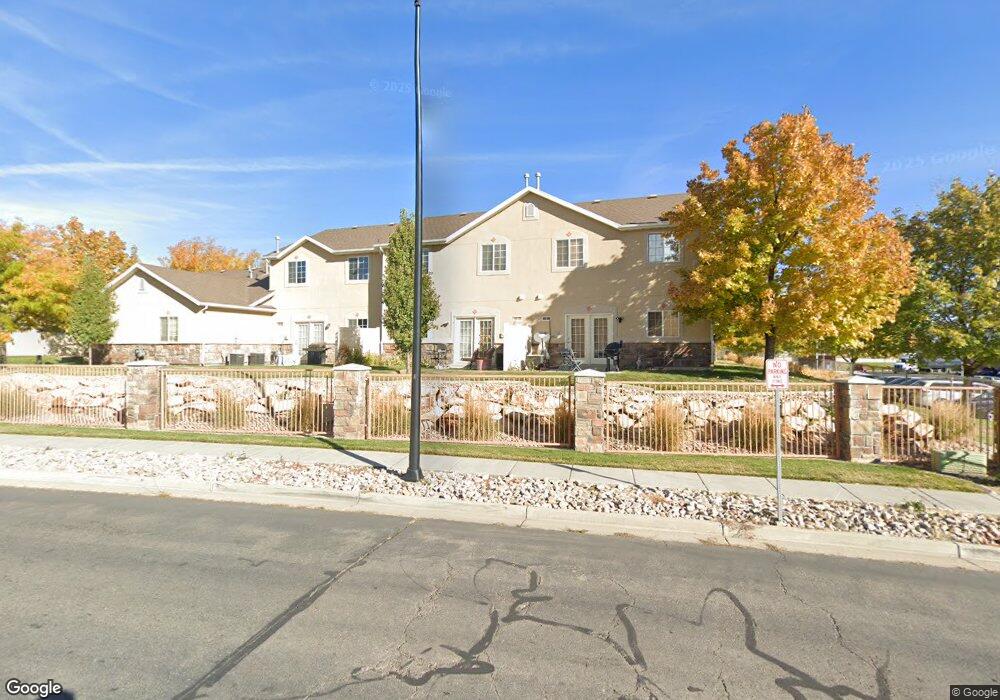
5539 Cisco Ct West Jordan, UT 84081
Copper Hills NeighborhoodEstimated Value: $349,000 - $376,443
3
Beds
2
Baths
1,320
Sq Ft
$277/Sq Ft
Est. Value
About This Home
This home is located at 5539 Cisco Ct, West Jordan, UT 84081 and is currently estimated at $365,111, approximately $276 per square foot. 5539 Cisco Ct is a home located in Salt Lake County with nearby schools including Copper Canyon School, West Hills Middle School, and Copper Hills High School.
Ownership History
Date
Name
Owned For
Owner Type
Purchase Details
Closed on
Apr 24, 2007
Sold by
Holcomb Michael
Bought by
Holcomb Michael and Morgan Stacey
Current Estimated Value
Home Financials for this Owner
Home Financials are based on the most recent Mortgage that was taken out on this home.
Original Mortgage
$139,900
Outstanding Balance
$84,401
Interest Rate
6.11%
Mortgage Type
New Conventional
Estimated Equity
$280,710
Purchase Details
Closed on
Jun 16, 2005
Sold by
Morgan Brandan L
Bought by
Morgan Brandan L and Morgan Rachel A
Home Financials for this Owner
Home Financials are based on the most recent Mortgage that was taken out on this home.
Original Mortgage
$27,150
Interest Rate
5.72%
Mortgage Type
Stand Alone Second
Purchase Details
Closed on
Jun 16, 2004
Sold by
Copper Hills Development Llc
Bought by
Morgan Brandan L
Home Financials for this Owner
Home Financials are based on the most recent Mortgage that was taken out on this home.
Original Mortgage
$108,650
Interest Rate
5.75%
Mortgage Type
Stand Alone First
Create a Home Valuation Report for This Property
The Home Valuation Report is an in-depth analysis detailing your home's value as well as a comparison with similar homes in the area
Home Values in the Area
Average Home Value in this Area
Purchase History
| Date | Buyer | Sale Price | Title Company |
|---|---|---|---|
| Holcomb Michael | -- | Inwest Title Services | |
| Morgan Brandan L | -- | Integrated Title Ins Svcs | |
| Morgan Brandan L | -- | Integrated Title Ins Svcs |
Source: Public Records
Mortgage History
| Date | Status | Borrower | Loan Amount |
|---|---|---|---|
| Open | Holcomb Michael | $139,900 | |
| Closed | Morgan Brandan L | $27,150 | |
| Previous Owner | Morgan Brandan L | $108,650 |
Source: Public Records
Tax History Compared to Growth
Tax History
| Year | Tax Paid | Tax Assessment Tax Assessment Total Assessment is a certain percentage of the fair market value that is determined by local assessors to be the total taxable value of land and additions on the property. | Land | Improvement |
|---|---|---|---|---|
| 2025 | $1,714 | $330,800 | $99,200 | $231,600 |
| 2024 | $1,714 | $329,700 | $98,900 | $230,800 |
| 2023 | $1,714 | $310,000 | $93,000 | $217,000 |
| 2022 | $1,834 | $327,200 | $98,100 | $229,100 |
| 2021 | $1,403 | $227,800 | $68,300 | $159,500 |
| 2020 | $1,461 | $222,600 | $66,800 | $155,800 |
| 2019 | $1,383 | $206,700 | $62,000 | $144,700 |
| 2018 | $1,267 | $187,800 | $56,300 | $131,500 |
| 2017 | $1,165 | $172,000 | $51,600 | $120,400 |
| 2016 | $1,118 | $155,000 | $46,500 | $108,500 |
| 2015 | $1,091 | $147,500 | $44,200 | $103,300 |
| 2014 | $1,097 | $146,000 | $43,800 | $102,200 |
Source: Public Records
Map
Nearby Homes
- 8793 S Big Bar Ct
- 5582 Washoe Cove
- 8854 Rocky Creek Dr
- 9118 S Wisteria Way
- 8453 S Windmill Dr
- 5098 Cherry Laurel Ln
- 8441 S Spratling Dr
- 8577 Autumn Gold Cir
- 8501 S Michele River Ave
- 8501 S Michele River Ave Unit 116
- 5946 W Eric Mountain Ln Unit 103
- 5946 W Eric Mountain Ln
- 5958 W Eric Mountain Ln
- 5958 W Eric Mountain Ln Unit 104
- 7214 S Sage Run Rd
- 5746 W Swift Creek Rd
- Larsen Plan at Copperhaven by Toll Brothers
- Brooke Plan at Copperhaven by Toll Brothers
- 8524 S Michele River Ave
- 5719 W Boulder Creek Rd
- 5533 W Cisco Ct
- 5533 Cisco Ct
- 5533 Cisco Ct Unit 4
- 5545 Cisco Ct
- 5549 Cisco Ct
- 5549 W Cisco Ct
- 5528 W Cisco Ct
- 5536 W Cisco Ct
- 5528 Cisco Ct
- 5536 Cisco Ct
- 5542 W Cisco Ct
- 5542 Cisco Ct
- 5548 Cisco Ct
- 5547 Copperwood Dr
- 8829 Humboldt Ct
- 8835 S Humboldt Ct
- 8829 S Humboldt Ct
- 5533 Bull Creek Ct
- 5532 Adamson Cir
- 8835 Humboldt Ct