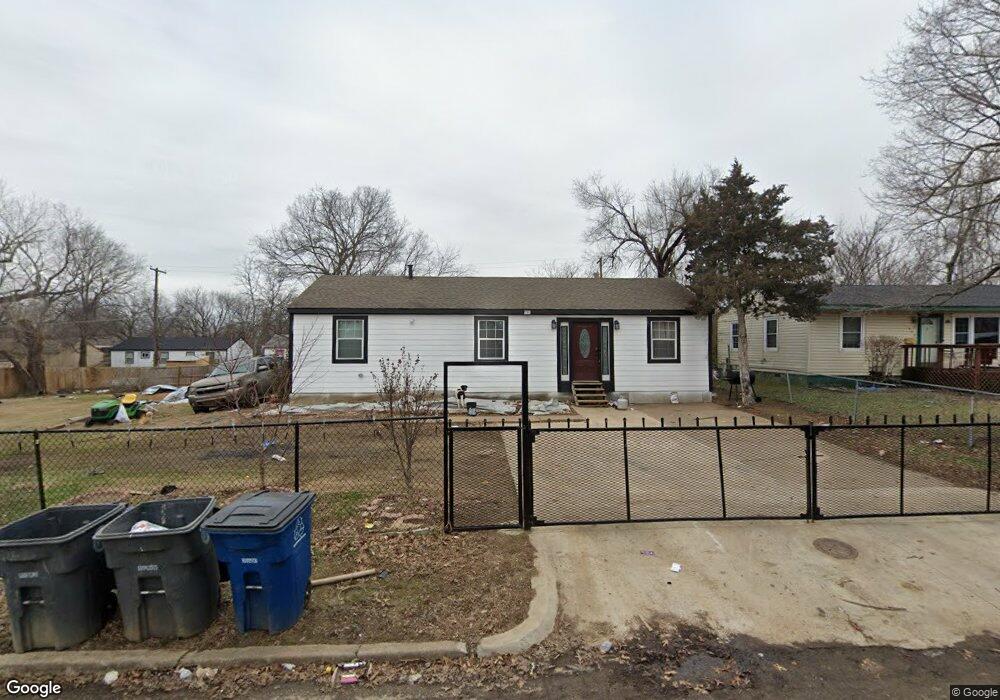
554 E 48th St N Tulsa, OK 74126
Chamberlain NeighborhoodEstimated Value: $76,000 - $105,000
3
Beds
1
Bath
888
Sq Ft
$98/Sq Ft
Est. Value
About This Home
This home is located at 554 E 48th St N, Tulsa, OK 74126 and is currently estimated at $87,122, approximately $98 per square foot. 554 E 48th St N is a home located in Tulsa County with nearby schools including Monroe Demonstration Academy, McLain High School of Science and Technology, and Tulsa Legacy Charter School.
Ownership History
Date
Name
Owned For
Owner Type
Purchase Details
Closed on
Apr 10, 2023
Sold by
Carranza Elman A
Bought by
Alvarado Everlin Gutierrez and Lugo Julissa Otero
Current Estimated Value
Purchase Details
Closed on
Mar 8, 2018
Sold by
Lipe Jeff
Bought by
Carranza Elman
Purchase Details
Closed on
Oct 28, 2014
Sold by
Sayer Scott
Bought by
Sharp Mortgage Co
Purchase Details
Closed on
Apr 24, 2007
Sold by
Buck Michelle Lee
Bought by
Buck Jonathan Henry
Purchase Details
Closed on
Apr 3, 2006
Sold by
White Hughlon Joe and White Madonna Ann
Bought by
Results Homebuyers Llc
Home Financials for this Owner
Home Financials are based on the most recent Mortgage that was taken out on this home.
Original Mortgage
$37,500
Interest Rate
6.21%
Mortgage Type
Purchase Money Mortgage
Purchase Details
Closed on
Jun 1, 2001
Sold by
White Hughlon Joe and White Hughlon J
Bought by
White Hughlon Joe and White Madonna Ann
Create a Home Valuation Report for This Property
The Home Valuation Report is an in-depth analysis detailing your home's value as well as a comparison with similar homes in the area
Home Values in the Area
Average Home Value in this Area
Purchase History
| Date | Buyer | Sale Price | Title Company |
|---|---|---|---|
| Alvarado Everlin Gutierrez | $3,000 | None Listed On Document | |
| Carranza Elman | $10,000 | None Available | |
| Sharp Mortgage Co | -- | None Available | |
| Buck Jonathan Henry | -- | None Available | |
| Results Homebuyers Llc | $21,500 | True Title | |
| White Hughlon Joe | -- | -- |
Source: Public Records
Mortgage History
| Date | Status | Borrower | Loan Amount |
|---|---|---|---|
| Previous Owner | Results Homebuyers Llc | $37,500 |
Source: Public Records
Tax History
| Year | Tax Paid | Tax Assessment Tax Assessment Total Assessment is a certain percentage of the fair market value that is determined by local assessors to be the total taxable value of land and additions on the property. | Land | Improvement |
|---|---|---|---|---|
| 2025 | $579 | $4,317 | $836 | $3,481 |
| 2024 | $381 | $4,111 | $957 | $3,154 |
| 2023 | $381 | $3,003 | $874 | $2,129 |
| 2022 | $381 | $2,860 | $957 | $1,903 |
| 2021 | $378 | $2,860 | $957 | $1,903 |
| 2020 | $373 | $2,860 | $957 | $1,903 |
| 2019 | $392 | $2,860 | $957 | $1,903 |
| 2018 | $402 | $2,926 | $957 | $1,969 |
| 2017 | $401 | $2,926 | $957 | $1,969 |
| 2016 | $393 | $2,926 | $957 | $1,969 |
| 2015 | $472 | $3,509 | $957 | $2,552 |
| 2014 | $467 | $3,509 | $957 | $2,552 |
Source: Public Records
Map
Nearby Homes
- 554 E 48th Place N
- 4670 N Hartford Ave
- 708 E 46th St N
- 516 E 45th Place N
- 4842 N Johnstown Ave
- 4371 N Garrison Place
- 4528 N Iroquois Ave
- 0 N Cincinnati Place
- 833 E 46th St N
- 1110 E 49th St N
- 4328 N Hartford Ave
- 4697 N Boston Place
- 543 E 52nd St N
- 250 E 51st Place N
- 4512 N Kenosha Ave
- 4303 N Frankfort Place
- 4503 N Kenosha Ave
- 4252 N Hartford Ave
- 658 E 53rd St N
- 809 E 52nd St N
- 560 E 48th St N
- 548 E 48th St N
- 564 E 48th St N
- 544 E 48th St N
- 607 E 47th Place N
- 549 E 47th Place N
- 543 E 47th Place N
- 613 E 47th Place N
- 553 E 48th St N
- 557 E 48th St N
- 547 E 48th St N
- 570 E 48th St N
- 538 E 48th St N
- 563 E 48th St N
- 543 E 48th St N
- 537 E 47th Place N
- 619 E 47th Place N
- 534 E 48th St N
- 537 E 48th St N
Your Personal Tour Guide
Ask me questions while you tour the home.