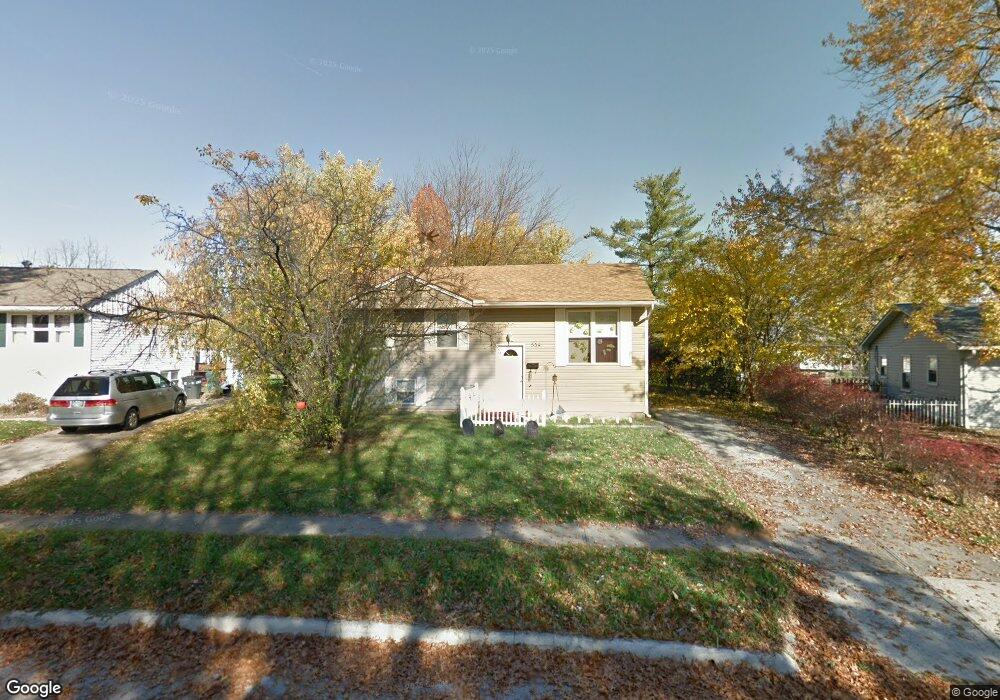
554 Fenchurch Way Columbus, OH 43230
Estimated Value: $255,932 - $285,000
4
Beds
2
Baths
1,437
Sq Ft
$188/Sq Ft
Est. Value
About This Home
This home is located at 554 Fenchurch Way, Columbus, OH 43230 and is currently estimated at $270,233, approximately $188 per square foot. 554 Fenchurch Way is a home located in Franklin County with nearby schools including Royal Manor Elementary School, Gahanna West Middle School, and Lincoln High School.
Ownership History
Date
Name
Owned For
Owner Type
Purchase Details
Closed on
Dec 7, 2007
Sold by
Soskin Alex
Bought by
Thorne Erica M and Thorne Johnny R
Current Estimated Value
Home Financials for this Owner
Home Financials are based on the most recent Mortgage that was taken out on this home.
Original Mortgage
$130,940
Outstanding Balance
$81,366
Interest Rate
6.3%
Mortgage Type
Purchase Money Mortgage
Estimated Equity
$188,867
Purchase Details
Closed on
Aug 16, 2007
Sold by
Equicredit Corp Of America
Bought by
Soskin Alex
Purchase Details
Closed on
Jun 15, 2007
Sold by
Nester Sheralee A and The Bank Of New York
Bought by
Equicredit Corp
Purchase Details
Closed on
Dec 21, 1987
Bought by
Nester Timmy E
Purchase Details
Closed on
Sep 1, 1979
Create a Home Valuation Report for This Property
The Home Valuation Report is an in-depth analysis detailing your home's value as well as a comparison with similar homes in the area
Purchase History
| Date | Buyer | Sale Price | Title Company |
|---|---|---|---|
| Thorne Erica M | $135,000 | Valmer Land | |
| Soskin Alex | $80,000 | Resource | |
| Equicredit Corp | $68,000 | Resource T | |
| Nester Timmy E | $60,900 | -- | |
| -- | $46,900 | -- |
Source: Public Records
Mortgage History
| Date | Status | Borrower | Loan Amount |
|---|---|---|---|
| Open | Thorne Erica M | $130,940 |
Source: Public Records
Tax History
| Year | Tax Paid | Tax Assessment Tax Assessment Total Assessment is a certain percentage of the fair market value that is determined by local assessors to be the total taxable value of land and additions on the property. | Land | Improvement |
|---|---|---|---|---|
| 2025 | $4,380 | $74,350 | $24,750 | $49,600 |
| 2024 | $4,380 | $74,350 | $24,750 | $49,600 |
| 2023 | $4,325 | $74,340 | $24,745 | $49,595 |
| 2022 | $3,704 | $49,600 | $13,340 | $36,260 |
| 2021 | $3,582 | $49,600 | $13,340 | $36,260 |
| 2020 | $3,552 | $49,600 | $13,340 | $36,260 |
| 2019 | $2,942 | $40,990 | $11,130 | $29,860 |
| 2018 | $2,971 | $40,990 | $11,130 | $29,860 |
| 2017 | $2,859 | $40,990 | $11,130 | $29,860 |
| 2016 | $3,018 | $41,730 | $9,840 | $31,890 |
| 2015 | $3,021 | $41,730 | $9,840 | $31,890 |
| 2014 | $2,997 | $41,730 | $9,840 | $31,890 |
| 2013 | $1,488 | $41,720 | $9,835 | $31,885 |
Source: Public Records
Map
Nearby Homes
- 278 Empire Dr
- 730 Penny Ct
- 388 Elkwood Place
- 595 Deerwood Ave E
- 362 Banbury Dr
- 371 Banbury Dr
- 394 Banbury Dr
- 424 Lincolnshire Rd
- 427 Canfield Dr
- 395 Amesbury Dr
- 292 Moorfield Dr
- 2225 Mifflin Blvd
- 439 Canterwood Ct
- 2655 Aeden Dr
- 4083 MacAldus Dr
- 475 Denwood Ct
- 208 Rugby Ln
- 0 E Aberdeen Ave Unit 226006710
- 464 Foxwood Dr
- 4125 Emerius Dr
- 550 Fenchurch Way
- 558 Fenchurch Way
- 165 Empire Dr
- 159 Empire Dr
- 173 Empire Dr
- 562 Fenchurch Way
- 546 Palace Ln
- 553 Fenchurch Way
- 532 Palace Ln
- 563 Fenchurch Way
- 181 Empire Dr
- 564 Palace Ln
- 568 Fenchurch Way
- 571 Fenchurch Way
- 549 Knights Ave
- 572 Palace Ln
- 189 Empire Dr
- 574 Fenchurch Way
- 555 Knights Ave
- 168 Empire Dr
Your Personal Tour Guide
Ask me questions while you tour the home.