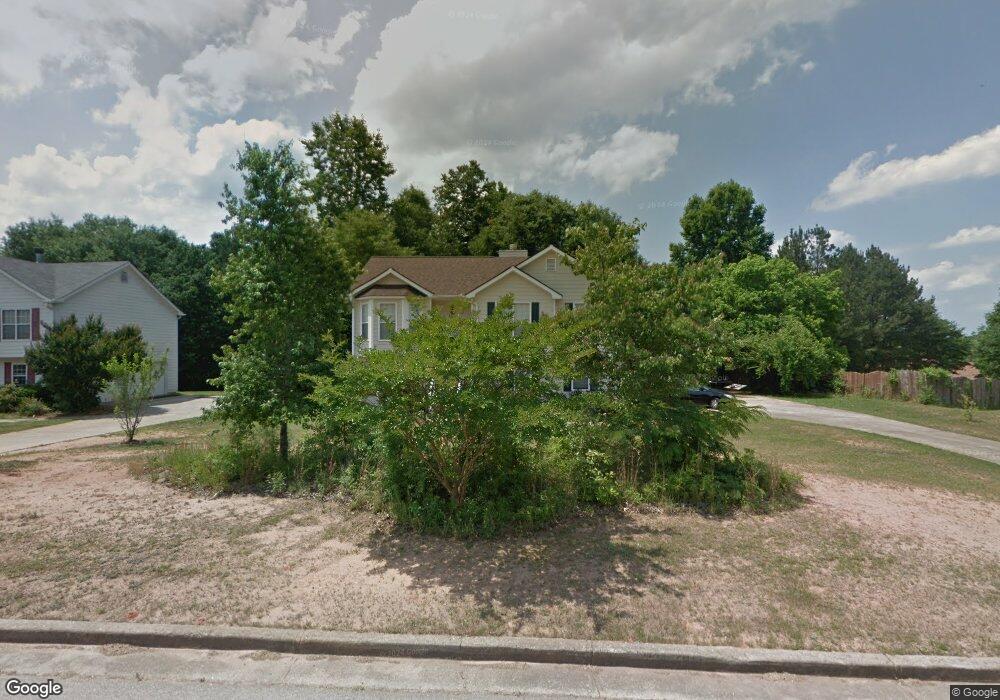
554 Hickeria Way Unit 2 Winder, GA 30680
Estimated Value: $333,000 - $362,000
3
Beds
3
Baths
1,843
Sq Ft
$187/Sq Ft
Est. Value
About This Home
This home is located at 554 Hickeria Way Unit 2, Winder, GA 30680 and is currently estimated at $344,426, approximately $186 per square foot. 554 Hickeria Way Unit 2 is a home located in Barrow County with nearby schools including Holsenbeck Elementary School, Bear Creek Middle School, and Winder-Barrow High School.
Ownership History
Date
Name
Owned For
Owner Type
Purchase Details
Closed on
Sep 30, 2002
Sold by
Miller Ronald J and Miller Judith M
Bought by
Janvier Nathasha
Current Estimated Value
Home Financials for this Owner
Home Financials are based on the most recent Mortgage that was taken out on this home.
Original Mortgage
$116,303
Outstanding Balance
$48,830
Interest Rate
6.18%
Mortgage Type
New Conventional
Estimated Equity
$295,596
Purchase Details
Closed on
Jul 26, 2000
Sold by
Bji Inc
Bought by
Miller Ronald J and Miller Judith M
Home Financials for this Owner
Home Financials are based on the most recent Mortgage that was taken out on this home.
Original Mortgage
$91,750
Interest Rate
8.12%
Mortgage Type
New Conventional
Purchase Details
Closed on
Feb 9, 2000
Sold by
H K B Inc
Bought by
Bji Inc
Purchase Details
Closed on
Jul 2, 1998
Bought by
H K B Inc
Create a Home Valuation Report for This Property
The Home Valuation Report is an in-depth analysis detailing your home's value as well as a comparison with similar homes in the area
Home Values in the Area
Average Home Value in this Area
Purchase History
| Date | Buyer | Sale Price | Title Company |
|---|---|---|---|
| Janvier Nathasha | $119,900 | -- | |
| Miller Ronald J | $106,800 | -- | |
| Bji Inc | $19,900 | -- | |
| H K B Inc | -- | -- |
Source: Public Records
Mortgage History
| Date | Status | Borrower | Loan Amount |
|---|---|---|---|
| Open | Janvier Nathasha | $116,303 | |
| Previous Owner | Miller Ronald J | $91,750 |
Source: Public Records
Tax History Compared to Growth
Tax History
| Year | Tax Paid | Tax Assessment Tax Assessment Total Assessment is a certain percentage of the fair market value that is determined by local assessors to be the total taxable value of land and additions on the property. | Land | Improvement |
|---|---|---|---|---|
| 2024 | $2,694 | $110,707 | $25,200 | $85,507 |
| 2023 | $2,273 | $110,707 | $25,200 | $85,507 |
| 2022 | $2,628 | $93,928 | $20,400 | $73,528 |
| 2021 | $1,979 | $67,214 | $14,000 | $53,214 |
| 2020 | $1,921 | $65,214 | $12,000 | $53,214 |
| 2019 | $1,953 | $65,214 | $12,000 | $53,214 |
| 2018 | $1,682 | $57,089 | $12,000 | $45,089 |
| 2017 | $1,392 | $47,819 | $9,600 | $38,219 |
| 2016 | $1,303 | $45,669 | $12,000 | $33,669 |
| 2015 | $1,320 | $46,051 | $12,000 | $34,051 |
| 2014 | $1,144 | $39,931 | $5,880 | $34,051 |
| 2013 | -- | $38,286 | $5,880 | $32,406 |
Source: Public Records
Map
Nearby Homes
- 547 Hickeria Way
- 421 Arrowhatchee Dr
- 372 Ashton Way
- 698 Jefferson Hwy
- 475 Pendergrass Rd
- 273 Greystone Ct
- 662 Carla Ct
- 466 Pendergrass Rd
- 303 Rooks Rd
- 826 Crystal Meadow Dr
- 58 Cedar Bluff
- 855 Crystal Meadow Dr
- 457 Banff Dr
- 82 Cedar Bluff
- 1811 Alberta Ln
- 454 Banff Dr
- 1815 Alberta Ln
- 752 Moon Bridge Rd
- 552 Hickeria Way Unit 2
- 560 Hickeria Way
- 704 Apache Trail Unit 2
- 550 Hickeria Way
- 706 Apache Trail Unit 2
- 566 Hickeria Way Unit 2
- 555 Hickeria Way
- 553 Hickeria Way Unit 2
- 553 Hickeria Way
- 548 Hickeria Way
- 0 Apache Trail Unit 3175104
- 0 Apache Trail
- 557 Hickeria Way
- 551 Hickeria Way
- 708 Apache Trail
- 559 Hickeria Way
- 549 Hickeria Way Unit 2
- 540 Hickeria Way
- 540 Hickeria Way Unit 2
- 536 Hickeria Way