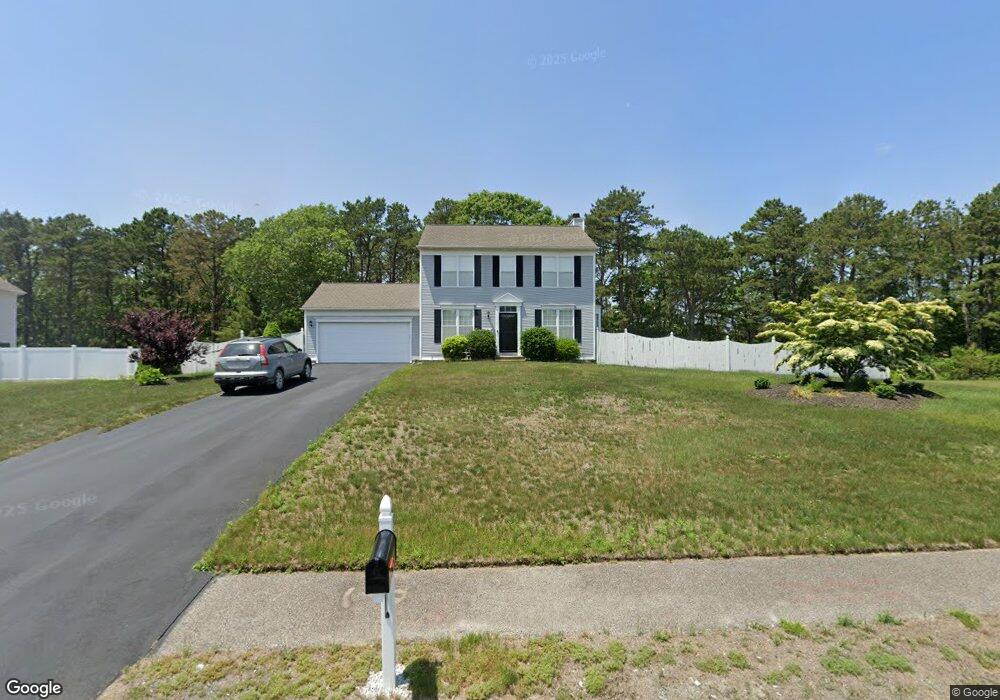
554 Lunns Way Plymouth, MA 02360
Estimated Value: $610,000 - $684,000
3
Beds
3
Baths
1,573
Sq Ft
$410/Sq Ft
Est. Value
About This Home
This home is located at 554 Lunns Way, Plymouth, MA 02360 and is currently estimated at $645,363, approximately $410 per square foot. 554 Lunns Way is a home located in Plymouth County with nearby schools including South Elementary School, Plymouth South Middle School, and Plymouth South High School.
Ownership History
Date
Name
Owned For
Owner Type
Purchase Details
Closed on
Apr 21, 2004
Sold by
Obrien Scott E and Obrien Nicole M
Bought by
Dias Jose P and Dias Monica M
Current Estimated Value
Home Financials for this Owner
Home Financials are based on the most recent Mortgage that was taken out on this home.
Original Mortgage
$274,000
Interest Rate
5.4%
Mortgage Type
Purchase Money Mortgage
Purchase Details
Closed on
Jun 27, 2003
Sold by
Sampson David R and Stahl Karla C
Bought by
Obrien Scott E and Obrien Nicole M
Purchase Details
Closed on
Mar 19, 2003
Sold by
Pulte Homes Of Ne Llc and Phne Bus T
Bought by
Sampson David R and Stahl Karla C
Purchase Details
Closed on
Oct 23, 2000
Sold by
Pulte Home Corp Of Ne
Bought by
Sampson David R and Stahl Karla C
Create a Home Valuation Report for This Property
The Home Valuation Report is an in-depth analysis detailing your home's value as well as a comparison with similar homes in the area
Home Values in the Area
Average Home Value in this Area
Purchase History
| Date | Buyer | Sale Price | Title Company |
|---|---|---|---|
| Dias Jose P | $342,500 | -- | |
| Obrien Scott E | $325,000 | -- | |
| Sampson David R | -- | -- | |
| Sampson David R | $189,276 | -- |
Source: Public Records
Mortgage History
| Date | Status | Borrower | Loan Amount |
|---|---|---|---|
| Open | Sampson David R | $312,640 | |
| Closed | Sampson David R | $309,320 | |
| Closed | Sampson David R | $274,000 |
Source: Public Records
Tax History Compared to Growth
Tax History
| Year | Tax Paid | Tax Assessment Tax Assessment Total Assessment is a certain percentage of the fair market value that is determined by local assessors to be the total taxable value of land and additions on the property. | Land | Improvement |
|---|---|---|---|---|
| 2025 | $7,039 | $554,700 | $204,800 | $349,900 |
| 2024 | $6,770 | $526,000 | $194,800 | $331,200 |
| 2023 | $6,571 | $479,300 | $176,800 | $302,500 |
| 2022 | $5,998 | $388,700 | $161,600 | $227,100 |
| 2021 | $5,929 | $366,900 | $161,600 | $205,300 |
| 2020 | $5,549 | $339,400 | $161,600 | $177,800 |
| 2019 | $5,385 | $325,600 | $146,600 | $179,000 |
| 2018 | $5,188 | $315,200 | $136,600 | $178,600 |
| 2017 | $4,893 | $295,100 | $136,600 | $158,500 |
| 2016 | $4,656 | $286,200 | $126,600 | $159,600 |
| 2015 | $4,305 | $277,000 | $116,600 | $160,400 |
| 2014 | $4,120 | $272,300 | $116,600 | $155,700 |
Source: Public Records
Map
Nearby Homes
- 43 Freeman Dr
- 464 Lunns Way
- 29 Pioneer Trail
- 455 Lunns Way
- 671 Lunns Way
- 2 Wind Rose Ln
- 2 Gabriel Ln
- 15 S Wind Dr
- 101 Perseverance Path
- 10 Gabriel Ln
- 119 Nathan Ln
- 19 Great Wind Dr
- 4 Sandpiper Ln
- 35 Scarlet Dr
- 206R Bourne Rd
- 18 Scarlet Dr
- 196 Bourne Rd
- 879 Long Pond Rd
- 885 Long Pond Rd
- 31 Fortune Dr