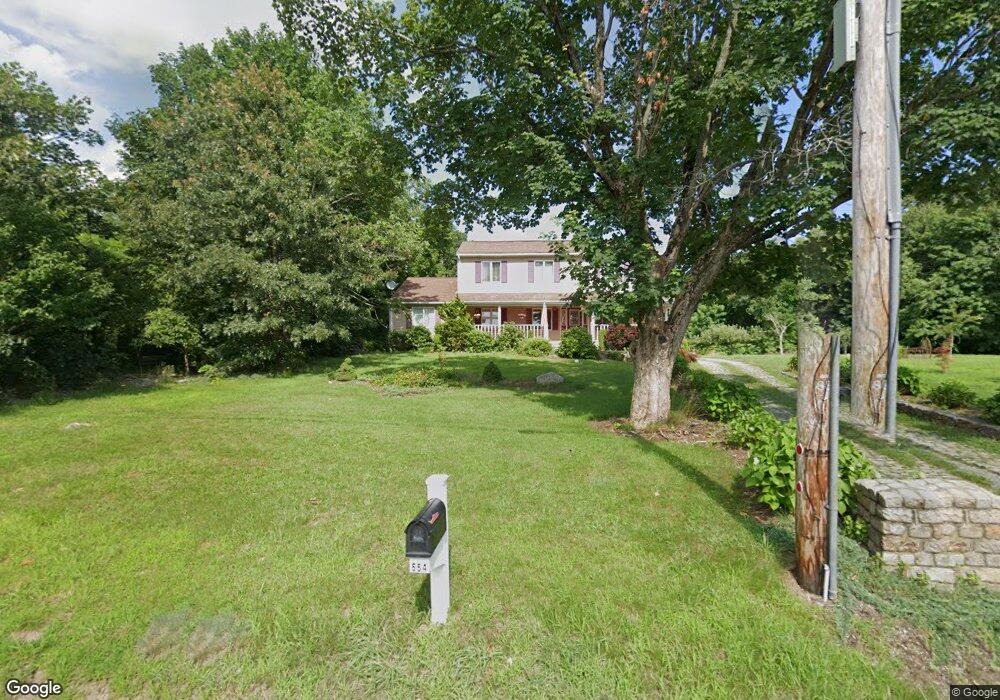
554 Sanford Rd Westport, MA 02790
North Westport NeighborhoodEstimated Value: $463,000 - $582,000
3
Beds
2
Baths
1,788
Sq Ft
$305/Sq Ft
Est. Value
About This Home
This home is located at 554 Sanford Rd, Westport, MA 02790 and is currently estimated at $544,810, approximately $304 per square foot. 554 Sanford Rd is a home located in Bristol County with nearby schools including Alice A. Macomber Primary School, Westport Elementary School, and Westport Middle-High School.
Ownership History
Date
Name
Owned For
Owner Type
Purchase Details
Closed on
Feb 2, 1995
Sold by
Kuemper Scott David
Bought by
Camara Carlos A and Camara Maria
Current Estimated Value
Home Financials for this Owner
Home Financials are based on the most recent Mortgage that was taken out on this home.
Original Mortgage
$66,800
Interest Rate
9.13%
Mortgage Type
Purchase Money Mortgage
Create a Home Valuation Report for This Property
The Home Valuation Report is an in-depth analysis detailing your home's value as well as a comparison with similar homes in the area
Home Values in the Area
Average Home Value in this Area
Purchase History
| Date | Buyer | Sale Price | Title Company |
|---|---|---|---|
| Camara Carlos A | $83,500 | -- |
Source: Public Records
Mortgage History
| Date | Status | Borrower | Loan Amount |
|---|---|---|---|
| Open | Camara Carlos A | $119,600 | |
| Closed | Camara Carlos A | $18,500 | |
| Closed | Camara Carlos A | $40,000 | |
| Closed | Camara Carlos A | $66,800 |
Source: Public Records
Tax History Compared to Growth
Tax History
| Year | Tax Paid | Tax Assessment Tax Assessment Total Assessment is a certain percentage of the fair market value that is determined by local assessors to be the total taxable value of land and additions on the property. | Land | Improvement |
|---|---|---|---|---|
| 2025 | $3,719 | $499,200 | $195,200 | $304,000 |
| 2024 | $3,315 | $428,900 | $173,900 | $255,000 |
| 2023 | $3,334 | $408,600 | $158,800 | $249,800 |
| 2022 | $3,230 | $380,900 | $158,800 | $222,100 |
| 2021 | $7,228 | $354,000 | $131,900 | $222,100 |
| 2020 | $2,942 | $349,000 | $126,900 | $222,100 |
| 2019 | $2,808 | $339,600 | $126,900 | $212,700 |
| 2018 | $3,315 | $313,400 | $124,600 | $188,800 |
| 2017 | $2,426 | $304,400 | $120,900 | $183,500 |
| 2016 | $2,378 | $300,600 | $117,100 | $183,500 |
| 2015 | $2,140 | $269,800 | $119,600 | $150,200 |
Source: Public Records
Map
Nearby Homes