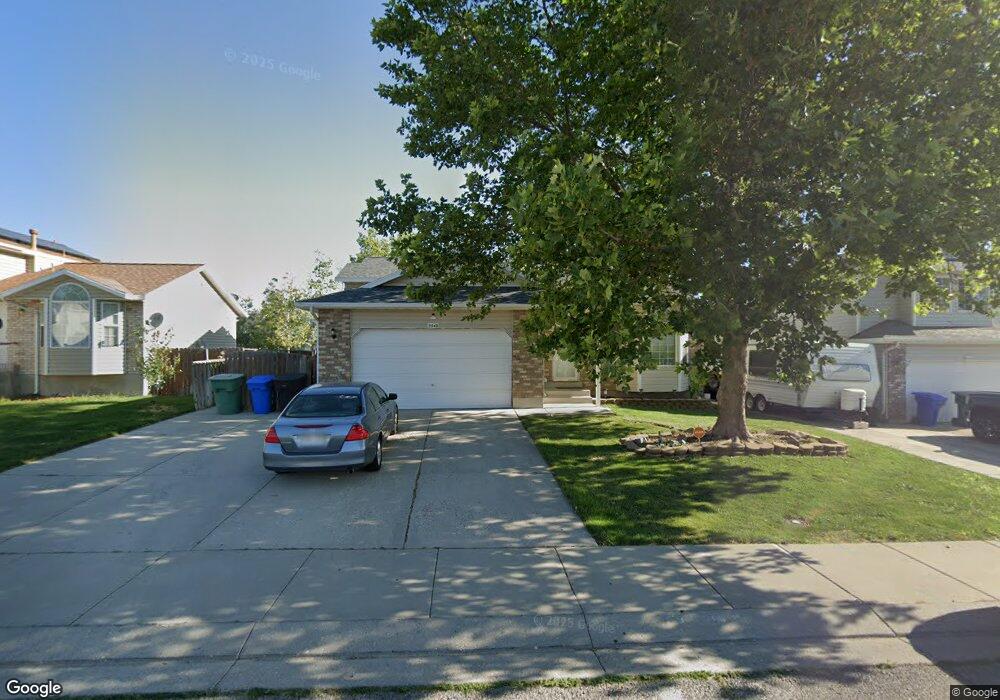
5540 W Tafoya Cir Unit 3208 West Jordan, UT 84081
Oquirrh NeighborhoodEstimated Value: $512,000 - $561,000
3
Beds
2
Baths
2,352
Sq Ft
$225/Sq Ft
Est. Value
About This Home
This home is located at 5540 W Tafoya Cir Unit 3208, West Jordan, UT 84081 and is currently estimated at $529,307, approximately $225 per square foot. 5540 W Tafoya Cir Unit 3208 is a home located in Salt Lake County with nearby schools including Mountain Shadows School, West Hills Middle School, and Copper Hills High School.
Ownership History
Date
Name
Owned For
Owner Type
Purchase Details
Closed on
Nov 29, 2002
Sold by
Anderson Richard D and Howman Linda C
Bought by
Thomas David W
Current Estimated Value
Home Financials for this Owner
Home Financials are based on the most recent Mortgage that was taken out on this home.
Original Mortgage
$133,412
Outstanding Balance
$60,913
Interest Rate
7.12%
Estimated Equity
$468,394
Purchase Details
Closed on
Sep 25, 1997
Sold by
Kokopelli Ltd
Bought by
Anderson Richard D and Howman Linda C
Home Financials for this Owner
Home Financials are based on the most recent Mortgage that was taken out on this home.
Original Mortgage
$132,300
Interest Rate
7.54%
Create a Home Valuation Report for This Property
The Home Valuation Report is an in-depth analysis detailing your home's value as well as a comparison with similar homes in the area
Home Values in the Area
Average Home Value in this Area
Purchase History
| Date | Buyer | Sale Price | Title Company |
|---|---|---|---|
| Thomas David W | -- | First American Title | |
| Anderson Richard D | -- | -- |
Source: Public Records
Mortgage History
| Date | Status | Borrower | Loan Amount |
|---|---|---|---|
| Open | Thomas David W | $133,412 | |
| Previous Owner | Anderson Richard D | $132,300 | |
| Closed | Thomas David W | $33,353 |
Source: Public Records
Tax History Compared to Growth
Tax History
| Year | Tax Paid | Tax Assessment Tax Assessment Total Assessment is a certain percentage of the fair market value that is determined by local assessors to be the total taxable value of land and additions on the property. | Land | Improvement |
|---|---|---|---|---|
| 2025 | $2,769 | $496,500 | $110,000 | $386,500 |
| 2024 | $2,769 | $468,100 | $103,700 | $364,400 |
| 2023 | $2,761 | $438,500 | $99,700 | $338,800 |
| 2022 | $2,745 | $433,400 | $97,800 | $335,600 |
| 2021 | $2,412 | $353,500 | $75,200 | $278,300 |
| 2020 | $2,249 | $307,800 | $75,200 | $232,600 |
| 2019 | $2,200 | $294,600 | $71,000 | $223,600 |
| 2018 | $2,060 | $272,100 | $71,000 | $201,100 |
| 2017 | $1,960 | $255,200 | $71,000 | $184,200 |
| 2016 | $1,920 | $235,100 | $71,000 | $164,100 |
| 2015 | $1,679 | $198,400 | $68,000 | $130,400 |
| 2014 | $1,641 | $190,400 | $65,900 | $124,500 |
Source: Public Records
Map
Nearby Homes
- 5502 Starflower Way
- 6922 Mullien Dr
- 7758 S Iron Core Ln
- 7146 W Owens View Way Unit 204
- 7259 W Cibola Rd
- 5466 Ticklegrass Rd
- 6853 Mullien Dr Unit 5420
- 6839 S Cyclamen Dr
- 5557 W Joshua Cir
- 6739 S Sol Rise Dr
- 7134 S Rialto Way
- 7043 S Orion Hill Rd
- 6721 Adventure Way
- 5732 W Moon Crest Ct
- 5281 Saguaro Dr
- 6977 W Hidden Way S Unit 147
- 7296 S Sophia Ridge Ct
- 5208 W Case Mountain Rd
- 7232 W Terraine Rd
- 7238 W Terraine Rd
- 5540 Tafoya Cir
- 5532 W Tafoya Cir
- 5532 Tafoya Cir
- 5548 Tafoya Cir
- 5548 W Tafoya Cir
- 5537 Lopalena Cir
- 5545 Lopalena Cir
- 5529 Lopalena Cir
- 5520 W Tafoya Cir Unit 3206
- 5553 Lopalena Cir
- 5556 Tafoya Cir
- 5520 Tafoya Cir
- 6948 S Lotus Way
- 6948 Lotus Way
- 5537 Tafoya Cir
- 5545 Tafoya Cir
- 5553 Tafoya Cir
- 5565 Lopalena Cir
- 5565 W Lopalena Cir
- 5537 W Tafoya Cir