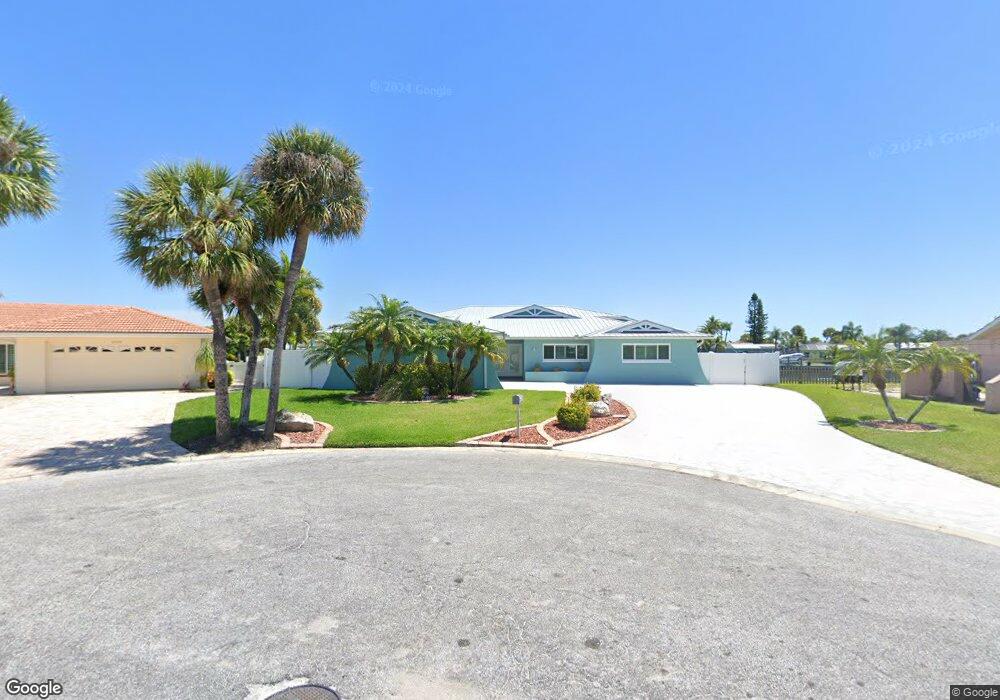
5540 Windward Way New Port Richey, FL 34652
Flor-A-Mar NeighborhoodEstimated Value: $1,023,321 - $1,203,000
3
Beds
3
Baths
2,930
Sq Ft
$373/Sq Ft
Est. Value
About This Home
This home is located at 5540 Windward Way, New Port Richey, FL 34652 and is currently estimated at $1,093,080, approximately $373 per square foot. 5540 Windward Way is a home located in Pasco County with nearby schools including Mittye P. Locke Elementary School, Richey Elementary School, and Gulf Middle School.
Ownership History
Date
Name
Owned For
Owner Type
Purchase Details
Closed on
Oct 8, 2019
Sold by
Zet Properties Beach Llc
Bought by
Schlichter Mark E and Schlichter Jane E
Current Estimated Value
Purchase Details
Closed on
Aug 28, 2018
Sold by
Schlichter Mark E and Schlichter Jane E
Bought by
Zet Properties Beach Llc
Purchase Details
Closed on
Oct 24, 2008
Sold by
May John C and May Alice
Bought by
Schlichter Mark and Schlichter Jane
Home Financials for this Owner
Home Financials are based on the most recent Mortgage that was taken out on this home.
Original Mortgage
$310,000
Interest Rate
6.11%
Mortgage Type
Purchase Money Mortgage
Purchase Details
Closed on
Mar 31, 1995
Sold by
Johnson Keith D and Johnson Barbara J
Bought by
May John C and May Alice
Home Financials for this Owner
Home Financials are based on the most recent Mortgage that was taken out on this home.
Original Mortgage
$71,581
Interest Rate
8.7%
Mortgage Type
Purchase Money Mortgage
Create a Home Valuation Report for This Property
The Home Valuation Report is an in-depth analysis detailing your home's value as well as a comparison with similar homes in the area
Home Values in the Area
Average Home Value in this Area
Purchase History
| Date | Buyer | Sale Price | Title Company |
|---|---|---|---|
| Schlichter Mark E | -- | Attorney | |
| Zet Properties Beach Llc | -- | Attorney | |
| Schlichter Mark | $460,000 | Attorney | |
| May John C | $140,000 | -- |
Source: Public Records
Mortgage History
| Date | Status | Borrower | Loan Amount |
|---|---|---|---|
| Previous Owner | Schlichter Mark | $310,000 | |
| Previous Owner | May John C | $71,581 |
Source: Public Records
Tax History Compared to Growth
Tax History
| Year | Tax Paid | Tax Assessment Tax Assessment Total Assessment is a certain percentage of the fair market value that is determined by local assessors to be the total taxable value of land and additions on the property. | Land | Improvement |
|---|---|---|---|---|
| 2025 | $14,422 | $924,578 | $322,413 | $602,165 |
| 2024 | $14,422 | $949,232 | $322,413 | $626,819 |
| 2023 | $13,460 | $687,620 | $0 | $0 |
| 2022 | $10,832 | $770,452 | $281,411 | $489,041 |
| 2021 | $9,224 | $565,147 | $202,499 | $362,648 |
| 2020 | $8,659 | $529,589 | $192,216 | $337,373 |
| 2019 | $8,425 | $547,840 | $192,216 | $355,624 |
| 2018 | $7,360 | $442,600 | $192,216 | $250,384 |
| 2017 | $7,192 | $427,071 | $192,216 | $234,855 |
| 2016 | $6,779 | $395,649 | $192,216 | $203,433 |
| 2015 | $6,265 | $357,325 | $192,216 | $165,109 |
| 2014 | $5,880 | $350,899 | $192,216 | $158,683 |
Source: Public Records
Map
Nearby Homes
- 5521 Windward Way
- 5500 Leeward Ln
- 5524 Leeward Ln
- 3154 Brigantine Ct
- 0 W Shore Dr
- Lot 13 Captains Ct
- 5650 Westshore Dr
- 3300 Floramar Terrace
- 5339 Bowline Bend
- 3339 Seaway Dr
- 3358 Seaway Dr
- 3654 Corsair Ct
- 3532 Floramar Terrace
- 5145 Porpoise Place
- 3505 Seaway Dr
- 5572 Bowline Bend
- 3150 Trident Terrace
- 3719 Floramar Terrace
- 21 Westshore Dr
- 5141 Westshore Dr
- 5530 Windward Way
- 5550 Windward Way
- 5551 Windward Way
- 5520 Windward Way
- 5531 Windward Way
- 5510 Windward Way
- 5533 Pilots Place
- 5541 Pilots Place
- 5517 Pilots Place
- 5509 Pilots Place
- 5551 Pilots Place
- 5460 Windward Way
- 5501 Pilots Place
- 5461 Windward Way
- 5451 Pilots Place
- 5450 Windward Way
- 5524 Pilots Place