Estimated Value: $517,000 - $580,000
3
Beds
4
Baths
1,500
Sq Ft
$360/Sq Ft
Est. Value
About This Home
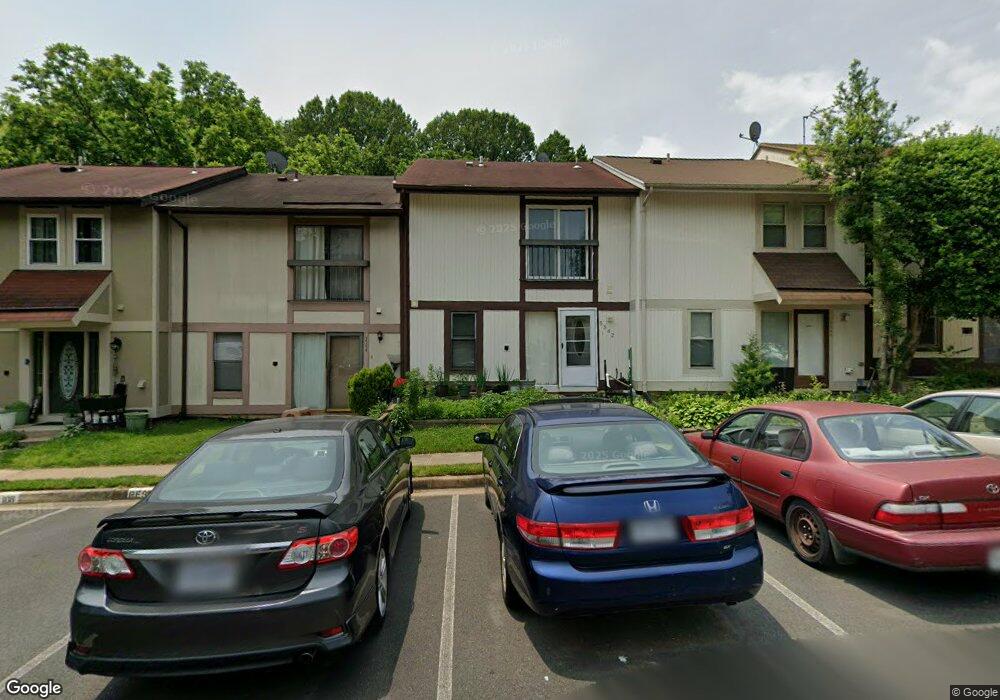
This home is located at 5542 Peppercorn Dr, Burke, VA 22015 and is currently estimated at $540,696, approximately $360 per square foot. 5542 Peppercorn Dr is a home located in Fairfax County with nearby schools including Kings Park Elementary School, Kings Glen Elementary School, and Lake Braddock Secondary School.
Ownership History
Date
Name
Owned For
Owner Type
Purchase Details
Closed on
Feb 10, 2010
Sold by
Federal Home Loan Mortgage Corporation
Bought by
Wu Huan Q
Current Estimated Value
Home Financials for this Owner
Home Financials are based on the most recent Mortgage that was taken out on this home.
Original Mortgage
$110,000
Outstanding Balance
$73,092
Interest Rate
5.11%
Mortgage Type
New Conventional
Estimated Equity
$467,604
Purchase Details
Closed on
Aug 12, 2009
Sold by
Professional Foreclosure Corp
Bought by
Federal Home Loan Mortgage Corporation
Purchase Details
Closed on
Apr 27, 2005
Sold by
Saini Sharanjit
Bought by
Mostajo Maria Alicia
Home Financials for this Owner
Home Financials are based on the most recent Mortgage that was taken out on this home.
Original Mortgage
$293,600
Interest Rate
5.95%
Mortgage Type
New Conventional
Create a Home Valuation Report for This Property
The Home Valuation Report is an in-depth analysis detailing your home's value as well as a comparison with similar homes in the area
Home Values in the Area
Average Home Value in this Area
Purchase History
| Date | Buyer | Sale Price | Title Company |
|---|---|---|---|
| Wu Huan Q | $216,000 | -- | |
| Federal Home Loan Mortgage Corporation | $228,431 | -- | |
| Mostajo Maria Alicia | $367,000 | -- |
Source: Public Records
Mortgage History
| Date | Status | Borrower | Loan Amount |
|---|---|---|---|
| Open | Wu Huan Q | $110,000 | |
| Previous Owner | Mostajo Maria Alicia | $293,600 |
Source: Public Records
Tax History Compared to Growth
Tax History
| Year | Tax Paid | Tax Assessment Tax Assessment Total Assessment is a certain percentage of the fair market value that is determined by local assessors to be the total taxable value of land and additions on the property. | Land | Improvement |
|---|---|---|---|---|
| 2025 | $5,229 | $512,530 | $200,000 | $312,530 |
| 2024 | $5,229 | $451,330 | $170,000 | $281,330 |
| 2023 | $4,904 | $434,590 | $170,000 | $264,590 |
| 2022 | $4,663 | $407,760 | $150,000 | $257,760 |
| 2021 | $4,590 | $391,180 | $140,000 | $251,180 |
| 2020 | $4,321 | $365,120 | $138,000 | $227,120 |
| 2019 | $3,897 | $329,260 | $115,000 | $214,260 |
| 2018 | $3,786 | $329,260 | $115,000 | $214,260 |
| 2017 | $3,686 | $317,490 | $105,000 | $212,490 |
| 2016 | $3,514 | $303,290 | $95,000 | $208,290 |
| 2015 | $3,321 | $297,610 | $95,000 | $202,610 |
| 2014 | $3,314 | $297,610 | $95,000 | $202,610 |
Source: Public Records
Map
Nearby Homes
- 9769 High Water Ct
- 9710 Ashbourn Dr
- 5711 Crownleigh Ct
- 9662 Westport Ln
- 5307 Richardson Dr
- 5714 Mason Bluff Dr
- 5658 Sutherland Ct
- 9909 Lakepointe Dr
- 9513 Burdett Rd
- 5502 Saddlebrook Ct
- 9438 Wallingford Dr
- 5432 Brixham Ct
- 5361 Gainsborough Dr
- 5137 Richardson Dr
- 5838 High Bluff Ct
- 5313 Stonington Dr
- 5504 Winford Ct
- 9717 Commonwealth Blvd
- 5608 Doolittle St
- 9316 Lee St
- 5544 Peppercorn Dr
- 5540 Peppercorn Dr
- 5546 Peppercorn Dr
- 5538 Peppercorn Dr
- 5548 Peppercorn Dr
- 5536 Peppercorn Dr
- 5550 Peppercorn Dr
- 5552 Peppercorn Dr
- 5534 Peppercorn Dr
- 5554 Peppercorn Dr
- 5532 Peppercorn Dr
- 5530 Peppercorn Dr
- 5528 Peppercorn Dr
- 5526 Peppercorn Dr
- 5535 Peppercorn Dr
- 5571 Peppercorn Dr
- 5573 Peppercorn Dr
- 5539 Peppercorn Dr
- 5569 Peppercorn Dr
- 5537 Peppercorn Dr