Estimated Value: $447,000 - $495,000
2
Beds
3
Baths
1,363
Sq Ft
$340/Sq Ft
Est. Value
About This Home
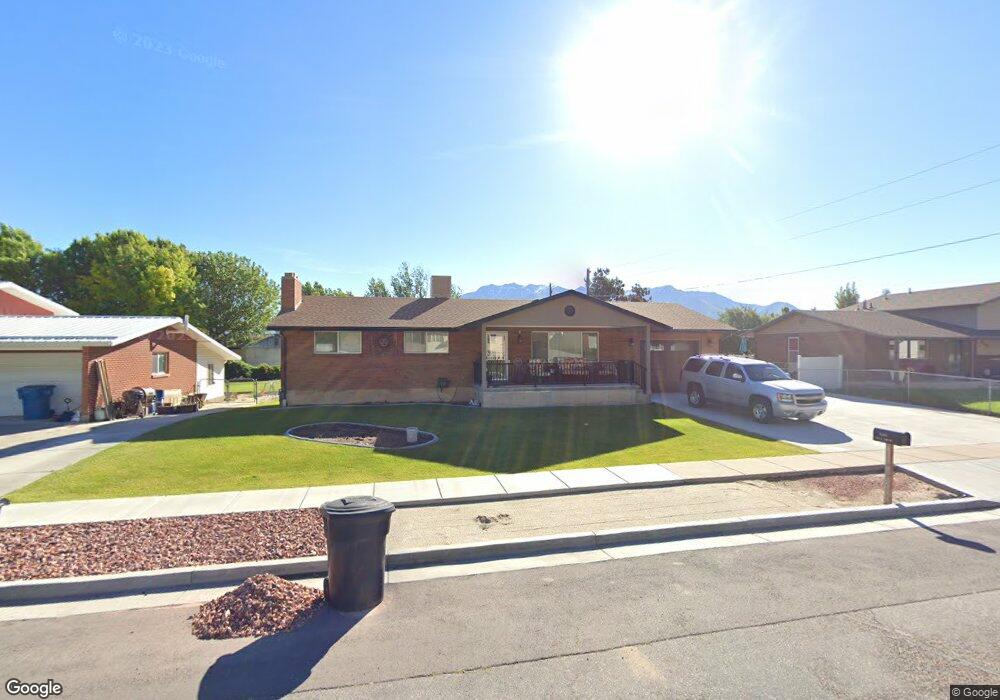
This home is located at 5542 S 1200 W, Ogden, UT 84405 and is currently estimated at $462,961, approximately $339 per square foot. 5542 S 1200 W is a home located in Weber County with nearby schools including Washington Terrace School, T.H. Bell Junior High School, and Bonneville High School.
Ownership History
Date
Name
Owned For
Owner Type
Purchase Details
Closed on
Jun 20, 2023
Sold by
Hammer Homes Llc
Bought by
Zamora-Velazquez Ervin Eduardo
Current Estimated Value
Purchase Details
Closed on
Jan 15, 2009
Sold by
Keller Brian Lee
Bought by
Keller Rodney Bart and Keller Bonnie Ann
Purchase Details
Closed on
Nov 14, 2003
Sold by
Keller Karen F
Bought by
Keller Rodney Bart and Keller Bonnie Ann
Purchase Details
Closed on
Jan 5, 2001
Sold by
Keller Karen F
Bought by
Keller Rodney Bart and Keller Bonnie Ann
Home Financials for this Owner
Home Financials are based on the most recent Mortgage that was taken out on this home.
Original Mortgage
$117,047
Interest Rate
7.65%
Mortgage Type
Seller Take Back
Create a Home Valuation Report for This Property
The Home Valuation Report is an in-depth analysis detailing your home's value as well as a comparison with similar homes in the area
Home Values in the Area
Average Home Value in this Area
Purchase History
| Date | Buyer | Sale Price | Title Company |
|---|---|---|---|
| Zamora-Velazquez Ervin Eduardo | -- | None Listed On Document | |
| Keller Rodney Bart | -- | None Available | |
| Keller Rodney Bart | -- | -- | |
| Keller Rodney Bart | -- | -- |
Source: Public Records
Mortgage History
| Date | Status | Borrower | Loan Amount |
|---|---|---|---|
| Previous Owner | Keller Rodney Bart | $117,047 |
Source: Public Records
Tax History Compared to Growth
Tax History
| Year | Tax Paid | Tax Assessment Tax Assessment Total Assessment is a certain percentage of the fair market value that is determined by local assessors to be the total taxable value of land and additions on the property. | Land | Improvement |
|---|---|---|---|---|
| 2025 | $2,573 | $455,107 | $144,431 | $310,676 |
| 2024 | $2,404 | $434,999 | $144,431 | $290,568 |
| 2023 | $2,312 | $415,000 | $142,989 | $272,011 |
| 2022 | $2,650 | $485,000 | $112,619 | $372,381 |
| 2021 | $2,021 | $372,001 | $72,415 | $299,586 |
| 2020 | $1,854 | $315,000 | $71,990 | $243,010 |
| 2019 | $1,921 | $309,000 | $43,884 | $265,116 |
| 2018 | $1,950 | $299,999 | $43,884 | $256,115 |
| 2017 | $1,770 | $260,000 | $43,884 | $216,116 |
| 2016 | $1,551 | $123,842 | $19,276 | $104,566 |
| 2015 | $1,474 | $115,111 | $18,743 | $96,368 |
| 2014 | $1,476 | $113,861 | $18,743 | $95,118 |
Source: Public Records
Map
Nearby Homes
- 5648 S 1150 W Unit 9
- 5648 S 1150 W Unit 30
- 5648 S 1150 W
- 949 W Columbia Ct Unit 106
- 946 W Columbia Ct Unit 107
- 945 W Motor Vu Dr Unit 206
- 939 W Motor Vu Dr Unit 205
- 5241 S Paramount Dr Unit 216
- 1004 W Motor Vu Dr Unit 213
- 5761 S Weber Dr Unit 2
- 5100 S 1050 W Unit D3
- 5100 S 1050 W Unit G111
- 5100 S 1050 W Unit E33
- 5100 S 1050 W Unit E37
- 5100 S 1050 W Unit H134
- 5100 S 1050 W Unit G63
- 5100 S 1050 W Unit A74
- 5228 900 W Unit 217
- 5315 S 1950 W
- 1777 W 5050 S