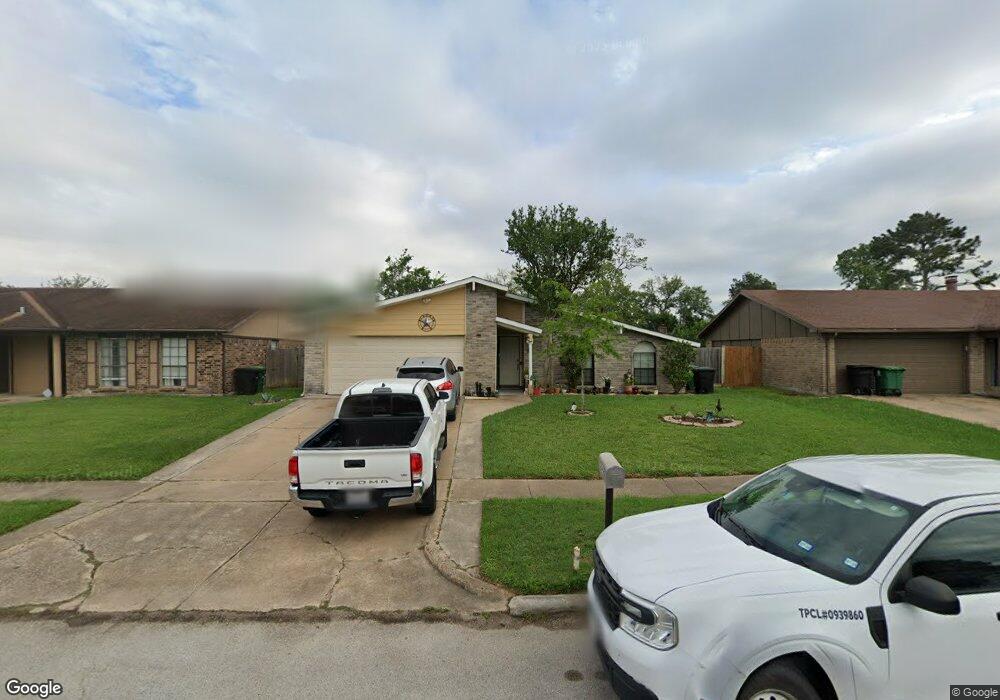
5542 W Ridgecreek Dr Houston, TX 77053
Fort Bend Houston NeighborhoodEstimated Value: $225,000 - $250,000
3
Beds
2
Baths
1,819
Sq Ft
$131/Sq Ft
Est. Value
About This Home
This home is located at 5542 W Ridgecreek Dr, Houston, TX 77053 and is currently estimated at $238,531, approximately $131 per square foot. 5542 W Ridgecreek Dr is a home located in Fort Bend County with nearby schools including Ridgegate Elementary School, Christa McAuliffe Middle School, and Willowridge High School.
Ownership History
Date
Name
Owned For
Owner Type
Purchase Details
Closed on
Mar 27, 2015
Sold by
Flagg Antoine D and Flagg Syntoria
Bought by
Ortez Carlos Ofidio and Chavez Blanca Lidia
Current Estimated Value
Home Financials for this Owner
Home Financials are based on the most recent Mortgage that was taken out on this home.
Original Mortgage
$96,224
Outstanding Balance
$78,504
Interest Rate
5.5%
Mortgage Type
FHA
Estimated Equity
$160,027
Purchase Details
Closed on
Jun 4, 1996
Sold by
Thomas George and George Thresiamma
Bought by
Flagg Antoine D and Flagg Syntoria
Home Financials for this Owner
Home Financials are based on the most recent Mortgage that was taken out on this home.
Original Mortgage
$48,450
Interest Rate
7.92%
Purchase Details
Closed on
Nov 26, 1986
Sold by
Va
Bought by
Ortez Carlos Ofidio and Blanca Lidia Chavez
Purchase Details
Closed on
Dec 4, 1984
Sold by
Southern Art E
Bought by
Ortez Carlos Ofidio and Blanca Lidia Chavez
Create a Home Valuation Report for This Property
The Home Valuation Report is an in-depth analysis detailing your home's value as well as a comparison with similar homes in the area
Home Values in the Area
Average Home Value in this Area
Purchase History
| Date | Buyer | Sale Price | Title Company |
|---|---|---|---|
| Ortez Carlos Ofidio | -- | Stewart Title | |
| Flagg Antoine D | -- | Title Agency | |
| Ortez Carlos Ofidio | -- | -- | |
| Ortez Carlos Ofidio | -- | -- |
Source: Public Records
Mortgage History
| Date | Status | Borrower | Loan Amount |
|---|---|---|---|
| Open | Ortez Carlos Ofidio | $96,224 | |
| Previous Owner | Flagg Antoine D | $48,450 |
Source: Public Records
Tax History Compared to Growth
Tax History
| Year | Tax Paid | Tax Assessment Tax Assessment Total Assessment is a certain percentage of the fair market value that is determined by local assessors to be the total taxable value of land and additions on the property. | Land | Improvement |
|---|---|---|---|---|
| 2025 | $5,157 | $250,862 | $26,000 | $224,862 |
| 2024 | $5,157 | $267,489 | $26,000 | $241,489 |
| 2023 | $4,815 | $247,260 | $20,000 | $227,260 |
| 2022 | $4,250 | $200,510 | $20,000 | $180,510 |
| 2021 | $3,875 | $175,060 | $20,000 | $155,060 |
| 2020 | $3,916 | $173,620 | $20,000 | $153,620 |
| 2019 | $4,045 | $170,500 | $20,000 | $150,500 |
| 2018 | $3,538 | $149,100 | $20,000 | $129,100 |
| 2017 | $2,954 | $123,070 | $20,000 | $103,070 |
| 2016 | $2,498 | $104,060 | $20,000 | $84,060 |
| 2015 | $1,025 | $78,670 | $20,000 | $58,670 |
| 2014 | $1,040 | $71,520 | $20,000 | $51,520 |
Source: Public Records
Map
Nearby Homes
- 15915 Dante Dr
- 15903 Lenclaire Dr
- 5614 Condon Ln
- 5619 Gineridge Dr
- 5774 Gineridge Dr
- 5605 Melanite Ave
- 5710 W Ridgecreek Dr
- 5622 Lycomb Dr
- 16226 Alden Ridge Dr
- 5310 Ridgeton Dr
- 5418 Arthington St
- 5734 Arthington St
- 6018 Beaconridge Dr
- 16326 Bantam Ridge Ct
- 16210 Rosenridge Dr
- 15806 Corsair Rd
- 6101 Maywood Dr
- 5121 Mackinaw St
- 5310 Ingomar Way
- 16302 Edgemont Dr
- 5546 W Ridgecreek Dr
- 5538 W Ridgecreek Dr
- 5519 Irish Hill Dr
- 5523 Irish Hill Dr
- 5550 W Ridgecreek Dr
- 5515 Irish Hill Dr
- 15818 Darton St
- 15814 Darton St
- 5539 W Ridgecreek Dr
- 5543 W Ridgecreek Dr
- 5602 W Ridgecreek Dr
- 5531 Irish Hill Dr
- 5535 W Ridgecreek Dr
- 15810 Darton St
- 5606 W Ridgecreek Dr
- 5531 W Ridgecreek Dr
- 5603 Irish Hill Dr
- 15907 Dante Dr
- 5518 Irish Hill Dr
- 5526 Irish Hill Dr