Estimated Value: $235,000 - $250,000
2
Beds
1
Bath
1,050
Sq Ft
$230/Sq Ft
Est. Value
About This Home
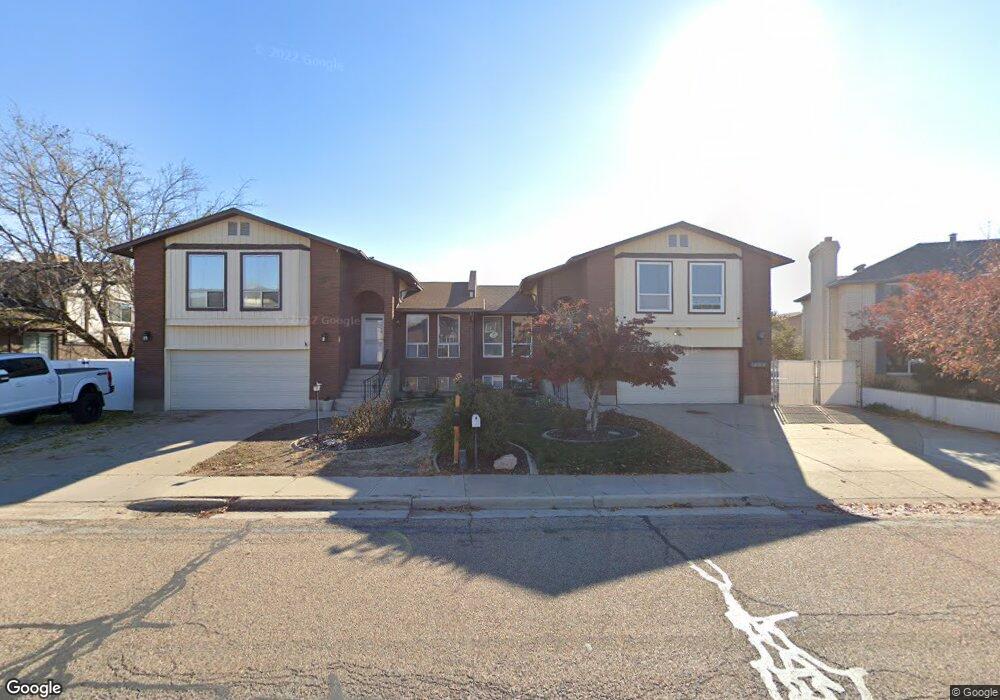
This home is located at 5545 S 2100 W Unit 13, Roy, UT 84067 and is currently estimated at $241,479, approximately $229 per square foot. 5545 S 2100 W Unit 13 is a home located in Weber County with nearby schools including Lakeview Elementary School, Roy Junior High School, and Roy High School.
Ownership History
Date
Name
Owned For
Owner Type
Purchase Details
Closed on
Jul 11, 2022
Sold by
Marie Crowder Elisabeth
Bought by
Mcmillan Troy
Current Estimated Value
Home Financials for this Owner
Home Financials are based on the most recent Mortgage that was taken out on this home.
Original Mortgage
$220,000
Outstanding Balance
$209,557
Interest Rate
5.23%
Mortgage Type
New Conventional
Estimated Equity
$31,922
Purchase Details
Closed on
Jun 9, 2021
Sold by
Leany Lloyd and Leany Florence
Bought by
Crowder Elisabeth Marie
Home Financials for this Owner
Home Financials are based on the most recent Mortgage that was taken out on this home.
Original Mortgage
$11,700
Interest Rate
2.96%
Mortgage Type
New Conventional
Purchase Details
Closed on
Mar 23, 2000
Sold by
Leany Florence I
Bought by
Leany Lloyd H and Leany Florence I
Create a Home Valuation Report for This Property
The Home Valuation Report is an in-depth analysis detailing your home's value as well as a comparison with similar homes in the area
Home Values in the Area
Average Home Value in this Area
Purchase History
| Date | Buyer | Sale Price | Title Company |
|---|---|---|---|
| Mcmillan Troy | -- | Old Republic Title | |
| Crowder Elisabeth Marie | -- | Hickman Land Title Co | |
| Leany Lloyd H | -- | Associated Title |
Source: Public Records
Mortgage History
| Date | Status | Borrower | Loan Amount |
|---|---|---|---|
| Open | Mcmillan Troy | $220,000 | |
| Previous Owner | Crowder Elisabeth Marie | $11,700 | |
| Previous Owner | Crowder Elisabeth Marie | $196,377 |
Source: Public Records
Tax History Compared to Growth
Tax History
| Year | Tax Paid | Tax Assessment Tax Assessment Total Assessment is a certain percentage of the fair market value that is determined by local assessors to be the total taxable value of land and additions on the property. | Land | Improvement |
|---|---|---|---|---|
| 2025 | $1,333 | $235,090 | $55,000 | $180,090 |
| 2024 | $1,289 | $125,950 | $30,250 | $95,700 |
| 2023 | $1,253 | $122,650 | $30,250 | $92,400 |
| 2022 | $1,285 | $128,150 | $30,250 | $97,900 |
| 2021 | $974 | $161,000 | $19,000 | $142,000 |
| 2020 | $826 | $125,000 | $19,000 | $106,000 |
| 2019 | $741 | $106,000 | $15,000 | $91,000 |
| 2018 | $710 | $96,000 | $15,000 | $81,000 |
| 2017 | $561 | $71,400 | $11,000 | $60,400 |
| 2016 | $537 | $36,850 | $5,500 | $31,350 |
| 2015 | $521 | $36,850 | $5,500 | $31,350 |
| 2014 | $409 | $28,600 | $5,500 | $23,100 |
Source: Public Records
Map
Nearby Homes
- 5545 S 2100 W Unit 12
- 5545 S 2100 W Unit 20
- 5545 S 2100 W Unit D22
- 2146 W 5600 S Unit 29
- 2184 W 5500 S
- 5643 S 2200 W
- 5333 S 2200 W
- 5289 S 2200 W
- 5261 S 2200 W
- 5345 S 2425 W
- 5185 S 2100 W
- 5140 S 2100 W
- 5902 S 1900 W
- 5140 S 2175 W
- 5810 S 2550 W
- 5326 S 2675 W
- 2571 W 5725 S
- 2266 W 5100 S
- 2587 W 5750 S
- 2646 W 5625 S Unit M-2646
- 5545 S 2100 W Unit 24
- 5545 S 2100 W Unit 23
- 5545 S 2100 W Unit D22
- 5545 S 2100 W Unit 21
- 5545 S 2100 W Unit 20
- 5545 S 2100 W Unit 19
- 5545 S 2100 W Unit 18
- 5545 S 2100 W Unit 17
- 5545 S 2100 W Unit C16
- 5545 S 2100 W Unit 15
- 5545 S 2100 W Unit 14
- 5545 S 2100 W Unit 12
- 5545 S 2100 W Unit 11
- 5545 S 2100 W Unit 10
- 5545 S 2100 W Unit B9
- 5545 S 2100 W Unit 8
- 5545 S 2100 W Unit 7
- 5545 S 2100 W Unit 6
- 5545 S 2100 W Unit 5
- 5545 S 2100 W Unit 4