Estimated Value: $233,000 - $247,000
2
Beds
1
Bath
1,050
Sq Ft
$228/Sq Ft
Est. Value
About This Home
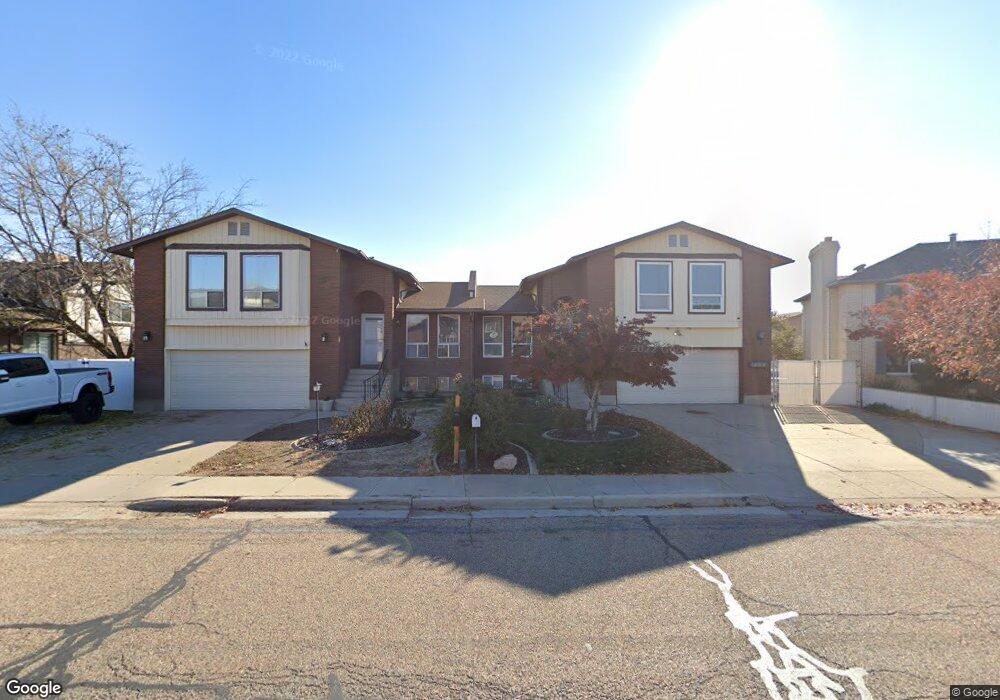
This home is located at 5545 S 2100 W Unit 20, Roy, UT 84067 and is currently estimated at $239,483, approximately $228 per square foot. 5545 S 2100 W Unit 20 is a home located in Weber County with nearby schools including Lakeview Elementary School, Roy Junior High School, and Roy High School.
Ownership History
Date
Name
Owned For
Owner Type
Purchase Details
Closed on
Apr 30, 2025
Sold by
Flanders Phil
Bought by
Rosewood Manor Llc
Current Estimated Value
Purchase Details
Closed on
Apr 11, 2025
Sold by
Halliday Watkins & Mann Pc
Bought by
Flanders Phil
Purchase Details
Closed on
Oct 30, 2014
Sold by
Seamons Braden C
Bought by
Mebus Patrick C
Home Financials for this Owner
Home Financials are based on the most recent Mortgage that was taken out on this home.
Original Mortgage
$55,200
Interest Rate
4.2%
Mortgage Type
New Conventional
Purchase Details
Closed on
Jun 7, 1996
Sold by
Williamson Ellary Kay and Williamson Nancy
Bought by
Seamons Braden C
Purchase Details
Closed on
Nov 30, 1984
Sold by
Binkowski Joseph F and Binkowski Constance J
Bought by
Seamons Braden C
Purchase Details
Closed on
Mar 24, 1979
Sold by
Hill Harvey F and Hill Marian M
Bought by
Binkowski Joseph F and Binkowski Constance J
Create a Home Valuation Report for This Property
The Home Valuation Report is an in-depth analysis detailing your home's value as well as a comparison with similar homes in the area
Home Values in the Area
Average Home Value in this Area
Purchase History
| Date | Buyer | Sale Price | Title Company |
|---|---|---|---|
| Rosewood Manor Llc | -- | Real Advantage Title | |
| Flanders Phil | $150,000 | None Listed On Document | |
| Mebus Patrick C | -- | Backman Title Services Ltd | |
| Seamons Braden C | -- | Associated Title | |
| Seamons Braden C | -- | Associated Title | |
| Seamons Braden C | -- | Associated Title | |
| Binkowski Joseph F | -- | Associated Title |
Source: Public Records
Mortgage History
| Date | Status | Borrower | Loan Amount |
|---|---|---|---|
| Previous Owner | Mebus Patrick C | $55,200 |
Source: Public Records
Tax History Compared to Growth
Tax History
| Year | Tax Paid | Tax Assessment Tax Assessment Total Assessment is a certain percentage of the fair market value that is determined by local assessors to be the total taxable value of land and additions on the property. | Land | Improvement |
|---|---|---|---|---|
| 2025 | $1,356 | $239,230 | $55,000 | $184,230 |
| 2024 | $1,311 | $128,150 | $30,250 | $97,900 |
| 2023 | $1,253 | $122,650 | $30,250 | $92,400 |
| 2022 | $1,285 | $128,150 | $30,250 | $97,900 |
| 2021 | $974 | $161,000 | $19,000 | $142,000 |
| 2020 | $826 | $125,000 | $19,000 | $106,000 |
| 2019 | $741 | $106,000 | $15,000 | $91,000 |
| 2018 | $710 | $96,000 | $15,000 | $81,000 |
| 2017 | $561 | $71,400 | $11,000 | $60,400 |
| 2016 | $537 | $36,850 | $5,500 | $31,350 |
| 2015 | $521 | $36,850 | $5,500 | $31,350 |
| 2014 | $409 | $28,600 | $5,500 | $23,100 |
Source: Public Records
Map
Nearby Homes
- 5545 S 2100 W Unit 12
- 5545 S 2100 W Unit 20
- 5545 S 2100 W Unit D22
- 2146 W 5600 S Unit 29
- 2184 W 5500 S
- 5643 S 2200 W
- 5333 S 2200 W
- 5289 S 2200 W
- 5261 S 2200 W
- 5243 S 2200 W
- 5345 S 2425 W
- 5185 S 2100 W
- 5140 S 2100 W
- 5902 S 1900 W
- 5140 S 2175 W
- 5810 S 2550 W
- 5326 S 2675 W
- 2571 W 5725 S
- 2266 W 5100 S
- 2587 W 5750 S
- 5545 S 2100 W Unit 24
- 5545 S 2100 W Unit 23
- 5545 S 2100 W Unit D22
- 5545 S 2100 W Unit 21
- 5545 S 2100 W Unit 19
- 5545 S 2100 W Unit 18
- 5545 S 2100 W Unit 17
- 5545 S 2100 W Unit C16
- 5545 S 2100 W Unit 15
- 5545 S 2100 W Unit 14
- 5545 S 2100 W Unit 13
- 5545 S 2100 W Unit 12
- 5545 S 2100 W Unit 11
- 5545 S 2100 W Unit 10
- 5545 S 2100 W Unit B9
- 5545 S 2100 W Unit 8
- 5545 S 2100 W Unit 7
- 5545 S 2100 W Unit 6
- 5545 S 2100 W Unit 5
- 5545 S 2100 W Unit 4