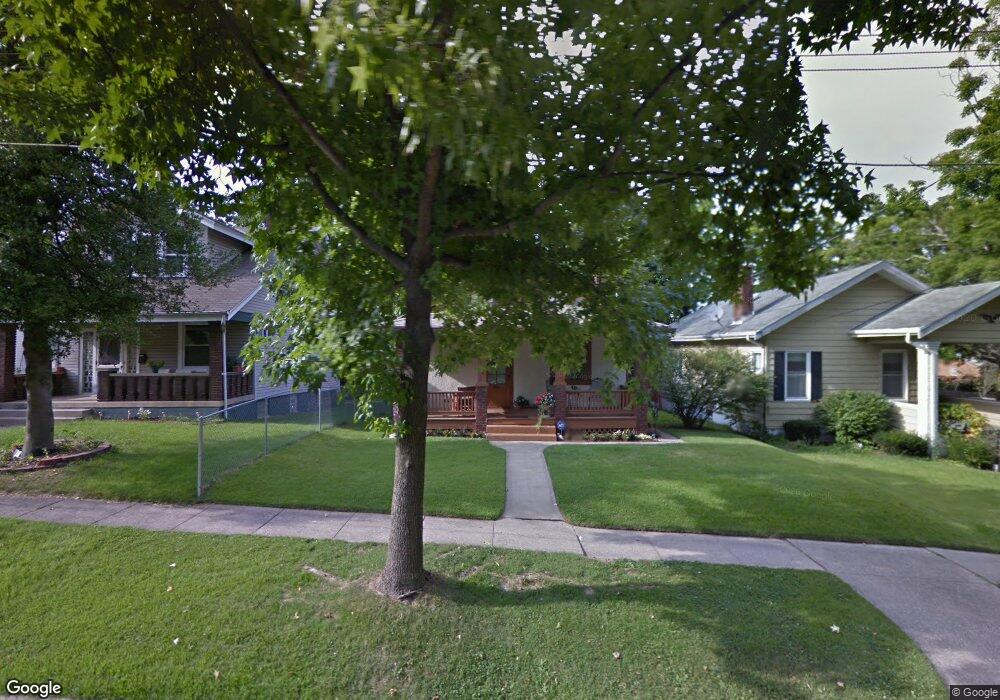
5546 Dunning Place Cincinnati, OH 45227
Madisonville NeighborhoodEstimated Value: $188,000 - $258,000
2
Beds
1
Bath
864
Sq Ft
$249/Sq Ft
Est. Value
About This Home
This home is located at 5546 Dunning Place, Cincinnati, OH 45227 and is currently estimated at $215,242, approximately $249 per square foot. 5546 Dunning Place is a home located in Hamilton County with nearby schools including Kilgour Elementary School, Shroder High School, and Clark Montessori High School.
Ownership History
Date
Name
Owned For
Owner Type
Purchase Details
Closed on
Jul 23, 2021
Sold by
Kendyco Properties Llc
Bought by
Kendyco Rental Properties Llc
Current Estimated Value
Purchase Details
Closed on
Feb 8, 2013
Sold by
Schroer Kendra G
Bought by
Kendyco Properties Llc
Purchase Details
Closed on
May 5, 2006
Sold by
Citifinancial Mortgage Co Inc
Bought by
Schroer Kendra G
Purchase Details
Closed on
Oct 7, 2005
Sold by
Johnson Kim M and Johnson David
Bought by
Citifinancial Mortgage Co Inc and Associates Home Equity Services Inc
Purchase Details
Closed on
Jun 26, 1998
Sold by
Manis Deborah and Jones Deborah
Bought by
Johnson David and Johnson Kim J
Home Financials for this Owner
Home Financials are based on the most recent Mortgage that was taken out on this home.
Original Mortgage
$63,450
Interest Rate
7.17%
Mortgage Type
FHA
Create a Home Valuation Report for This Property
The Home Valuation Report is an in-depth analysis detailing your home's value as well as a comparison with similar homes in the area
Home Values in the Area
Average Home Value in this Area
Purchase History
| Date | Buyer | Sale Price | Title Company |
|---|---|---|---|
| Kendyco Rental Properties Llc | -- | None Available | |
| Kendyco Rental Properties Llc | -- | None Listed On Document | |
| Kendyco Properties Llc | -- | Attorney | |
| Schroer Kendra G | $45,000 | Accutitle Agency Inc | |
| Citifinancial Mortgage Co Inc | $48,000 | Accutitle Agency Inc | |
| Johnson David | $63,500 | -- |
Source: Public Records
Mortgage History
| Date | Status | Borrower | Loan Amount |
|---|---|---|---|
| Previous Owner | Johnson David | $63,450 |
Source: Public Records
Tax History
| Year | Tax Paid | Tax Assessment Tax Assessment Total Assessment is a certain percentage of the fair market value that is determined by local assessors to be the total taxable value of land and additions on the property. | Land | Improvement |
|---|---|---|---|---|
| 2025 | $2,632 | $41,398 | $12,635 | $28,763 |
| 2024 | $2,628 | $41,398 | $12,635 | $28,763 |
| 2023 | $2,633 | $41,398 | $12,635 | $28,763 |
| 2022 | $1,621 | $22,856 | $6,227 | $16,629 |
| 2021 | $1,590 | $22,856 | $6,227 | $16,629 |
| 2020 | $1,595 | $22,856 | $6,227 | $16,629 |
| 2019 | $1,550 | $20,223 | $5,509 | $14,714 |
| 2018 | $1,551 | $20,223 | $5,509 | $14,714 |
| 2017 | $1,494 | $20,223 | $5,509 | $14,714 |
| 2016 | $1,353 | $17,847 | $5,261 | $12,586 |
| 2015 | $1,209 | $17,847 | $5,261 | $12,586 |
| 2014 | $1,216 | $17,847 | $5,261 | $12,586 |
| 2013 | $1,201 | $17,326 | $5,107 | $12,219 |
Source: Public Records
Map
Nearby Homes
- 4703 Stewart Ave
- 4527 Butterfield Place
- 5708 Carothers St
- 5704 Adelphi St
- 5702 Peabody Ave
- 5807 Prentice St
- 4400 Whetsel Ave
- 4700 Ward St
- 6611 Madison Rd
- 6009 Erie Ave
- 5811 Bramble Ave
- 5003 Anderson Place
- 5005 Anderson Place
- 5007 Anderson Place
- 5001 Anderson Place
- 5720 Madison Rd
- 6121 Roe St
- 6124 Clephane Ave
- 5708 Sierra Park Place
- 6011 Madison Rd
- 5542 Dunning Place
- 5548 Dunning Place
- 5540 Dunning Place
- 5550 Dunning Place
- 5538 Dunning Place
- 5552 Dunning Place
- 5536 Dunning Place
- 5537 Tompkins Ave
- 5554 Dunning Place
- 5534 Dunning Place
- 5529 Tompkins Ave
- 5543 Tompkins Ave
- 5525 Tompkins Ave
- 5556 Dunning Place
- 5532 Dunning Place
- 5521 Tompkins Ave
- 5530 Dunning Place
- 5614 Hidden St
- 5517 Tompkins Ave
- 4521 Erie Ave
Your Personal Tour Guide
Ask me questions while you tour the home.