Estimated Value: $425,606 - $452,000
5
Beds
1
Bath
1,346
Sq Ft
$327/Sq Ft
Est. Value
About This Home
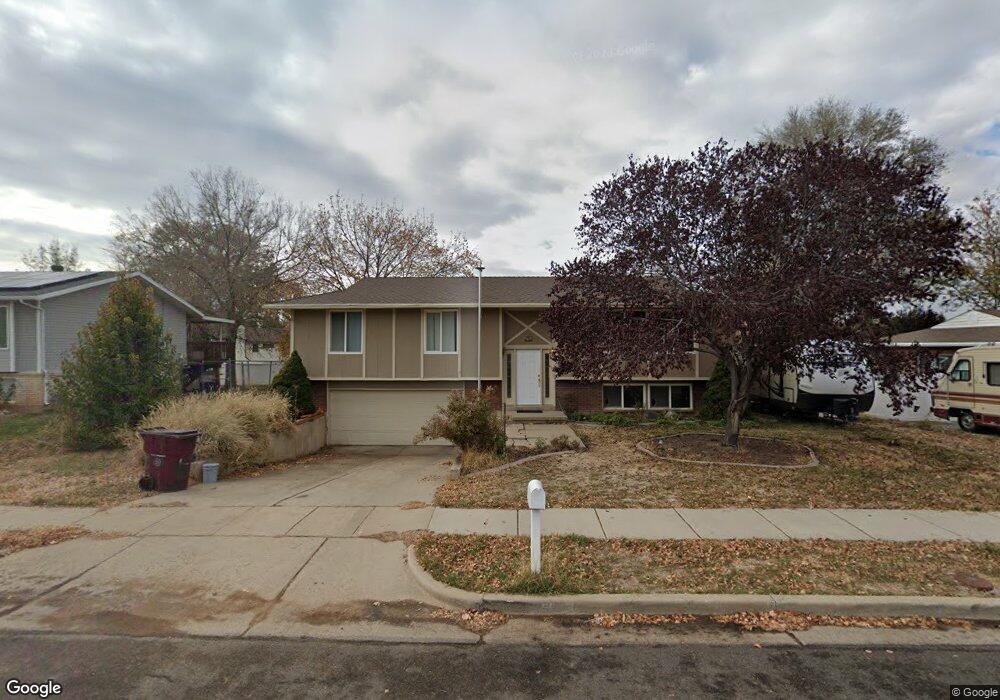
This home is located at 5547 S 3000 W, Roy, UT 84067 and is currently estimated at $439,652, approximately $326 per square foot. 5547 S 3000 W is a home located in Weber County with nearby schools including Roy Elementary School, Roy Junior High School, and Roy High School.
Ownership History
Date
Name
Owned For
Owner Type
Purchase Details
Closed on
Jan 15, 2021
Sold by
Smith Linda J and Allgood Susan R
Bought by
Burroughs Brandon
Current Estimated Value
Purchase Details
Closed on
Sep 9, 1997
Sold by
Burroughs Susan and Burroughs Susan R
Bought by
Allgood Susan R
Home Financials for this Owner
Home Financials are based on the most recent Mortgage that was taken out on this home.
Original Mortgage
$32,600
Interest Rate
7.34%
Create a Home Valuation Report for This Property
The Home Valuation Report is an in-depth analysis detailing your home's value as well as a comparison with similar homes in the area
Home Values in the Area
Average Home Value in this Area
Purchase History
| Date | Buyer | Sale Price | Title Company |
|---|---|---|---|
| Burroughs Brandon | -- | Hickman Land Title Layton | |
| Allgood Susan R | -- | Associated Title |
Source: Public Records
Mortgage History
| Date | Status | Borrower | Loan Amount |
|---|---|---|---|
| Previous Owner | Allgood Susan R | $32,600 |
Source: Public Records
Tax History Compared to Growth
Tax History
| Year | Tax Paid | Tax Assessment Tax Assessment Total Assessment is a certain percentage of the fair market value that is determined by local assessors to be the total taxable value of land and additions on the property. | Land | Improvement |
|---|---|---|---|---|
| 2025 | $2,671 | $424,336 | $123,561 | $300,775 |
| 2024 | $2,606 | $229,349 | $67,958 | $161,391 |
| 2023 | $2,414 | $211,750 | $66,744 | $145,006 |
| 2022 | $2,644 | $240,900 | $58,938 | $181,962 |
| 2021 | $2,089 | $311,000 | $76,581 | $234,419 |
| 2020 | $1,901 | $259,000 | $76,581 | $182,419 |
| 2019 | $1,792 | $229,000 | $46,247 | $182,753 |
| 2018 | $1,640 | $196,000 | $44,299 | $151,701 |
| 2017 | $1,541 | $172,000 | $44,299 | $127,701 |
| 2016 | $1,503 | $90,335 | $21,460 | $68,875 |
| 2015 | $1,347 | $82,213 | $21,460 | $60,753 |
| 2014 | $1,354 | $81,853 | $21,460 | $60,393 |
Source: Public Records
Map
Nearby Homes