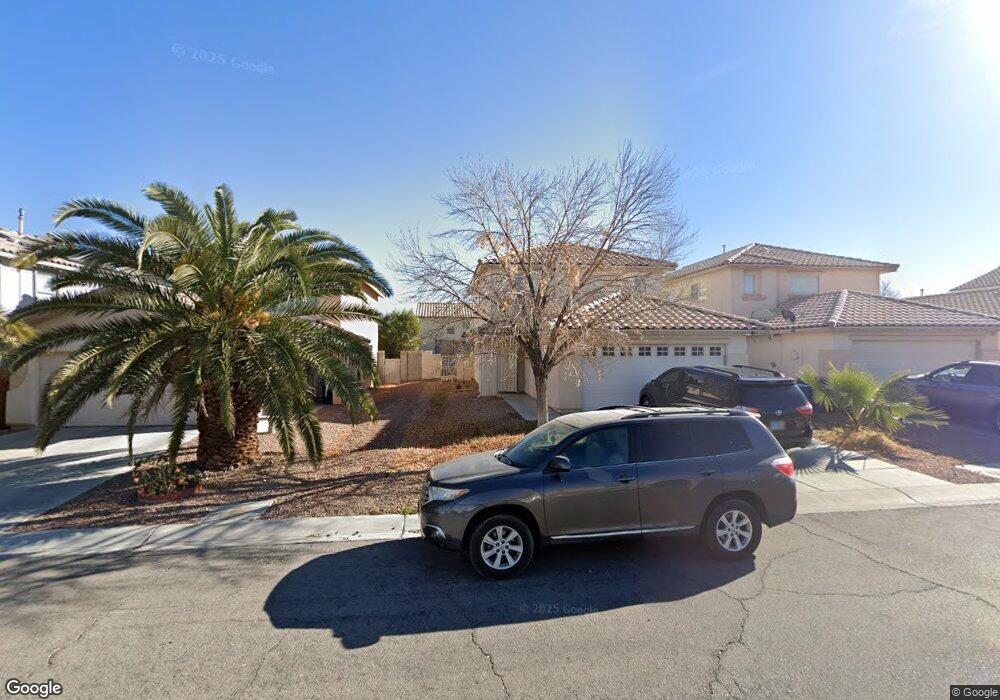
5548 Rollins St Las Vegas, NV 89118
Estimated Value: $397,048 - $449,000
3
Beds
3
Baths
1,824
Sq Ft
$233/Sq Ft
Est. Value
About This Home
This home is located at 5548 Rollins St, Las Vegas, NV 89118 and is currently estimated at $425,262, approximately $233 per square foot. 5548 Rollins St is a home located in Clark County with nearby schools including Helen Jydstrup Elementary School, Grant Sawyer Middle School, and Durango High School.
Ownership History
Date
Name
Owned For
Owner Type
Purchase Details
Closed on
Jun 4, 2013
Sold by
Jelde Biscut M
Bought by
Betru Menen Abredew
Current Estimated Value
Purchase Details
Closed on
Jun 5, 2012
Sold by
Federal National Mortgage Association
Bought by
Jelde Biscut M
Home Financials for this Owner
Home Financials are based on the most recent Mortgage that was taken out on this home.
Original Mortgage
$134,500
Interest Rate
3.62%
Mortgage Type
New Conventional
Purchase Details
Closed on
Mar 27, 2012
Sold by
Lopez Eden R
Bought by
Federal National Mortgage Association
Purchase Details
Closed on
Nov 13, 2001
Sold by
Kb Home Nevada Inc
Bought by
Lopez Eden R
Home Financials for this Owner
Home Financials are based on the most recent Mortgage that was taken out on this home.
Original Mortgage
$149,150
Interest Rate
6.62%
Create a Home Valuation Report for This Property
The Home Valuation Report is an in-depth analysis detailing your home's value as well as a comparison with similar homes in the area
Home Values in the Area
Average Home Value in this Area
Purchase History
| Date | Buyer | Sale Price | Title Company |
|---|---|---|---|
| Betru Menen Abredew | -- | None Available | |
| Jelde Biscut M | $150,000 | First American Title Paseo | |
| Federal National Mortgage Association | $226,531 | First American Title Default | |
| Lopez Eden R | $157,044 | First American Title Co |
Source: Public Records
Mortgage History
| Date | Status | Borrower | Loan Amount |
|---|---|---|---|
| Previous Owner | Jelde Biscut M | $134,500 | |
| Previous Owner | Lopez Eden R | $149,150 |
Source: Public Records
Tax History Compared to Growth
Tax History
| Year | Tax Paid | Tax Assessment Tax Assessment Total Assessment is a certain percentage of the fair market value that is determined by local assessors to be the total taxable value of land and additions on the property. | Land | Improvement |
|---|---|---|---|---|
| 2025 | $1,925 | $100,689 | $30,800 | $69,889 |
| 2024 | $1,869 | $100,689 | $30,800 | $69,889 |
| 2023 | $1,869 | $96,834 | $30,800 | $66,034 |
| 2022 | $1,990 | $85,560 | $25,200 | $60,360 |
| 2021 | $1,843 | $81,517 | $24,150 | $57,367 |
| 2020 | $1,708 | $78,576 | $21,700 | $56,876 |
| 2019 | $1,601 | $75,257 | $19,250 | $56,007 |
| 2018 | $1,527 | $69,054 | $15,400 | $53,654 |
| 2017 | $2,015 | $68,700 | $14,350 | $54,350 |
| 2016 | $1,431 | $65,833 | $11,550 | $54,283 |
| 2015 | $1,427 | $55,173 | $7,000 | $48,173 |
| 2014 | $1,385 | $45,827 | $7,000 | $38,827 |
Source: Public Records
Map
Nearby Homes
- 5691 Leaning Oak Ave
- 5607 W Dewey Dr
- 5461 Dungaree St
- 5449 Dungaree St
- 5434 Lost Ln
- 5404 Walcott Dr
- 5645 Warm Light St
- 5921 Spring Ranch Pkwy
- 5653 Artesia Lake Ct
- 5354 Silver Branch Ave
- 6012 Prospector Trail
- 5325 Nellie Bell St
- 5790 Westwind Rd
- 5508 Ness Ave
- 5771 Ritter Ln
- 5273 Wave Dancer Ln
- 5266 Souvenir Ln
- 5221 Lindell Rd Unit 206
- 6210 W Quail Ave
- 5251 Lindell Rd Unit 101
- 5558 Rollins St
- 5538 Rollins St Unit 3
- 5642 Heinrick Ct Unit 4
- 5568 Rollins St
- 5528 Rollins St
- 5632 Heinrick Ct
- 5578 Rollins St Unit 3
- 5714 Butterick Ct
- 5641 Briaton Ct
- 5518 Rollins St
- 5631 Briaton Ct
- 5622 Heinrick Ct
- 5588 Rollins St
- 5728 Butterick Ct
- 5643 Heinrick Ct Unit 4
- 5621 Briaton Ct
- 5727 Viberti Ct Unit 3
- 5612 Heinrick Ct
- 5715 Butterick Ct