Estimated Value: $405,000 - $474,000
6
Beds
3
Baths
2,414
Sq Ft
$183/Sq Ft
Est. Value
About This Home
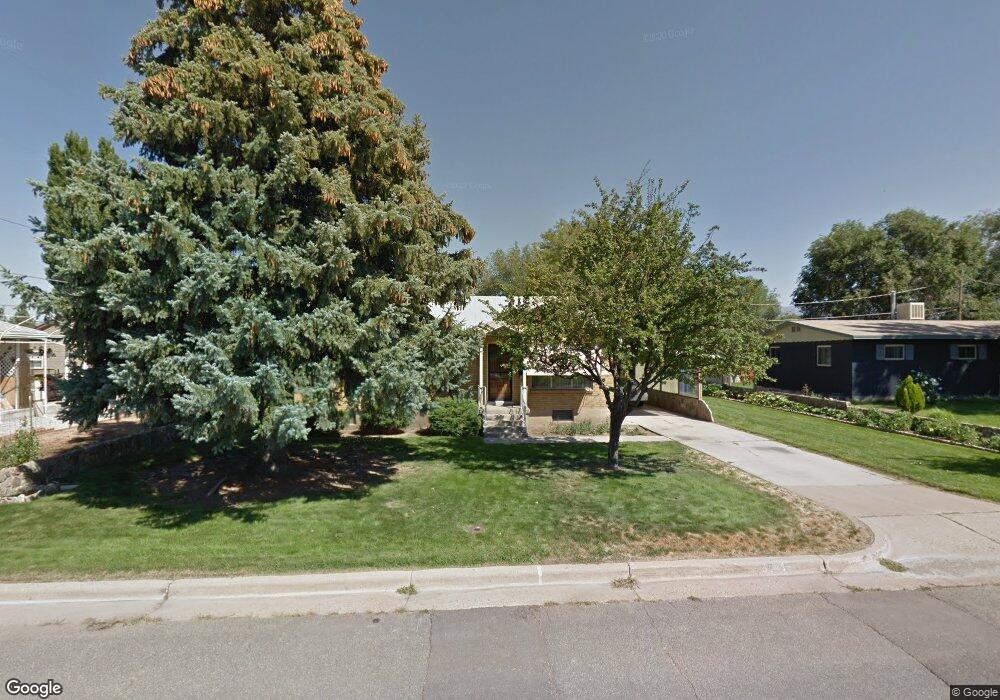
This home is located at 5548 S 2050 W, Roy, UT 84067 and is currently estimated at $442,283, approximately $183 per square foot. 5548 S 2050 W is a home located in Weber County with nearby schools including Lakeview Elementary School, Roy Junior High School, and Roy High School.
Ownership History
Date
Name
Owned For
Owner Type
Purchase Details
Closed on
May 13, 2024
Sold by
Catamount Properties 2018 Llc
Bought by
Giannitrapani-Swank Angela Maria and Giannitrapani Pamela
Current Estimated Value
Home Financials for this Owner
Home Financials are based on the most recent Mortgage that was taken out on this home.
Original Mortgage
$446,758
Outstanding Balance
$440,422
Interest Rate
6.82%
Mortgage Type
FHA
Estimated Equity
$1,861
Purchase Details
Closed on
Dec 12, 2023
Sold by
Halliday Watkins & Mann Pc
Bought by
Catamount Properties 2018 Llc
Purchase Details
Closed on
Dec 5, 2018
Sold by
Pingree Pence Nancy P and Pingree James W
Bought by
Kirkland Amber
Home Financials for this Owner
Home Financials are based on the most recent Mortgage that was taken out on this home.
Original Mortgage
$195,940
Interest Rate
4.8%
Mortgage Type
New Conventional
Create a Home Valuation Report for This Property
The Home Valuation Report is an in-depth analysis detailing your home's value as well as a comparison with similar homes in the area
Home Values in the Area
Average Home Value in this Area
Purchase History
| Date | Buyer | Sale Price | Title Company |
|---|---|---|---|
| Giannitrapani-Swank Angela Maria | -- | Inwest Title | |
| Catamount Properties 2018 Llc | -- | None Listed On Document | |
| Kirkland Amber | -- | Stewart Title Ins Agcy Of |
Source: Public Records
Mortgage History
| Date | Status | Borrower | Loan Amount |
|---|---|---|---|
| Open | Giannitrapani-Swank Angela Maria | $446,758 | |
| Previous Owner | Kirkland Amber | $195,940 |
Source: Public Records
Tax History Compared to Growth
Tax History
| Year | Tax Paid | Tax Assessment Tax Assessment Total Assessment is a certain percentage of the fair market value that is determined by local assessors to be the total taxable value of land and additions on the property. | Land | Improvement |
|---|---|---|---|---|
| 2025 | $2,248 | $349,707 | $115,672 | $234,035 |
| 2024 | $2,195 | $344,000 | $115,673 | $228,327 |
| 2023 | $2,245 | $195,250 | $61,354 | $133,896 |
| 2022 | $2,065 | $333,000 | $97,803 | $235,197 |
| 2021 | $1,768 | $258,000 | $68,071 | $189,929 |
| 2020 | $1,696 | $228,000 | $68,071 | $159,929 |
| 2019 | $1,617 | $204,000 | $38,410 | $165,590 |
| 2018 | $1,463 | $172,000 | $33,600 | $138,400 |
| 2017 | $1,431 | $158,000 | $33,600 | $124,400 |
| 2016 | $1,361 | $80,577 | $15,560 | $65,017 |
| 2015 | $1,223 | $73,465 | $15,560 | $57,905 |
| 2014 | $1,234 | $73,465 | $15,560 | $57,905 |
Source: Public Records
Map
Nearby Homes
- 5545 S 2100 W Unit 12
- 5545 S 2100 W Unit 20
- 5545 S 2100 W Unit D22
- 2146 W 5600 S Unit 29
- 2184 W 5500 S
- 5643 S 2200 W
- 5333 S 2200 W
- 5289 S 2200 W
- 5261 S 2200 W
- 5185 S 2100 W
- 5140 S 2100 W
- 5902 S 1900 W
- 5345 S 2425 W
- 5140 S 2175 W
- 5810 S 2550 W
- 2266 W 5100 S
- 5326 S 2675 W
- 2571 W 5725 S
- 2587 W 5750 S
- 2179 W 4975 S