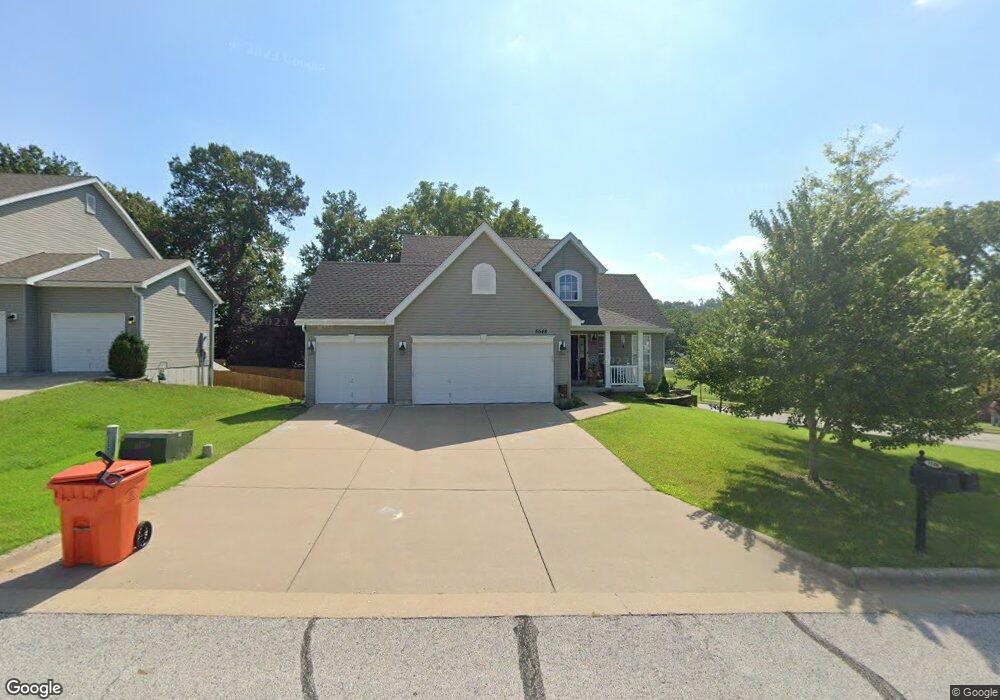
5548 Twelve Oaks Rd Springfield, MO 65810
Southwest Springfield NeighborhoodEstimated Value: $326,326 - $372,000
3
Beds
3
Baths
1,652
Sq Ft
$211/Sq Ft
Est. Value
About This Home
This home is located at 5548 Twelve Oaks Rd, Springfield, MO 65810 and is currently estimated at $348,082, approximately $210 per square foot. 5548 Twelve Oaks Rd is a home with nearby schools including Gray Elementary School, Wilson's Creek Intermediate School, and Cherokee Middle School.
Ownership History
Date
Name
Owned For
Owner Type
Purchase Details
Closed on
Aug 16, 2019
Sold by
Cates Connie R and Cates David
Bought by
Robertson Jonathan T and Robertson Anna M
Current Estimated Value
Home Financials for this Owner
Home Financials are based on the most recent Mortgage that was taken out on this home.
Original Mortgage
$216,750
Outstanding Balance
$143,355
Interest Rate
3.8%
Mortgage Type
New Conventional
Estimated Equity
$204,727
Purchase Details
Closed on
Aug 2, 2016
Sold by
Groves Joshua and Groves Brittany
Bought by
Culp Connie R
Home Financials for this Owner
Home Financials are based on the most recent Mortgage that was taken out on this home.
Original Mortgage
$180,000
Interest Rate
3.56%
Mortgage Type
Construction
Purchase Details
Closed on
Oct 31, 2012
Sold by
Mcbridge Springfield Llc
Bought by
Groves Joshua and Groves Brittany
Home Financials for this Owner
Home Financials are based on the most recent Mortgage that was taken out on this home.
Original Mortgage
$187,834
Interest Rate
3.25%
Mortgage Type
FHA
Create a Home Valuation Report for This Property
The Home Valuation Report is an in-depth analysis detailing your home's value as well as a comparison with similar homes in the area
Home Values in the Area
Average Home Value in this Area
Purchase History
| Date | Buyer | Sale Price | Title Company |
|---|---|---|---|
| Robertson Jonathan T | -- | None Available | |
| Culp Connie R | -- | None Available | |
| Groves Joshua | -- | None Available |
Source: Public Records
Mortgage History
| Date | Status | Borrower | Loan Amount |
|---|---|---|---|
| Open | Robertson Jonathan T | $216,750 | |
| Previous Owner | Culp Connie R | $180,000 | |
| Previous Owner | Groves Joshua | $187,834 |
Source: Public Records
Tax History
| Year | Tax Paid | Tax Assessment Tax Assessment Total Assessment is a certain percentage of the fair market value that is determined by local assessors to be the total taxable value of land and additions on the property. | Land | Improvement |
|---|---|---|---|---|
| 2025 | $2,613 | $50,720 | $7,130 | $43,590 |
| 2024 | $2,486 | $44,880 | $6,840 | $38,040 |
| 2023 | $2,472 | $44,880 | $6,840 | $38,040 |
| 2022 | $2,147 | $39,940 | $6,840 | $33,100 |
| 2021 | $2,146 | $39,940 | $6,840 | $33,100 |
| 2020 | $2,115 | $37,320 | $6,840 | $30,480 |
| 2019 | $2,054 | $37,320 | $6,840 | $30,480 |
| 2018 | $1,802 | $32,660 | $6,840 | $25,820 |
| 2017 | $1,784 | $30,570 | $6,840 | $23,730 |
| 2016 | $1,670 | $30,570 | $6,840 | $23,730 |
| 2015 | $1,657 | $30,570 | $6,840 | $23,730 |
| 2014 | $1,600 | $29,280 | $6,840 | $22,440 |
Source: Public Records
Map
Nearby Homes
- 5504 S Faust Ave
- 5375 S Twelve Oaks Rd
- 2063 W Melbourne Ct
- 5343 S Twelve Oaks Rd
- 2534 W Grayrock St
- 00 W Farm Road 182
- 5350 S Parklane Ave
- 5637 S Lexington Ave
- 5619 S Lexington Ave
- 5396 S Woodfield Ave
- 5348 S Woodfield Ave
- 1957 W Nottingham St
- 1747 W Nottingham St
- 5915 S Farm Rd 139
- 5735 S Farm Road 137
- 5940 S Hearthstone Ct
- 5946 S Hearthstone Ct
- 1978 W Williamsburg St
- 1633 W Silver Oak Dr
- 1568 W Gaslight Dr
- 5536 Twelve Oaks Rd
- 5524 Twelve Oaks Rd
- 5545 S Twelve Oaks Rd
- 5566 Twelve Oaks Rd
- 5533 S Twelve Oaks Rd
- 5535 S Farm Road 141
- 5563 S Twelve Oaks Rd
- 5523 S Farm Road 141
- 5512 S Twelve Oaks Rd
- 5521 S Twelve Oaks Rd
- 5511 S Farm Road 141
- 5500 Twelve Oaks Rd
- 5509 S Twelve Oaks Rd
- 5540 S Faust Ave
- 5552 Faust Ave
- 5528 S Faust Ave
- 5499 S Farm Road 141
- 5516 S Faust Ave
- 5564 S Faust Ave
- 5487 S Farm Road 141
Your Personal Tour Guide
Ask me questions while you tour the home.