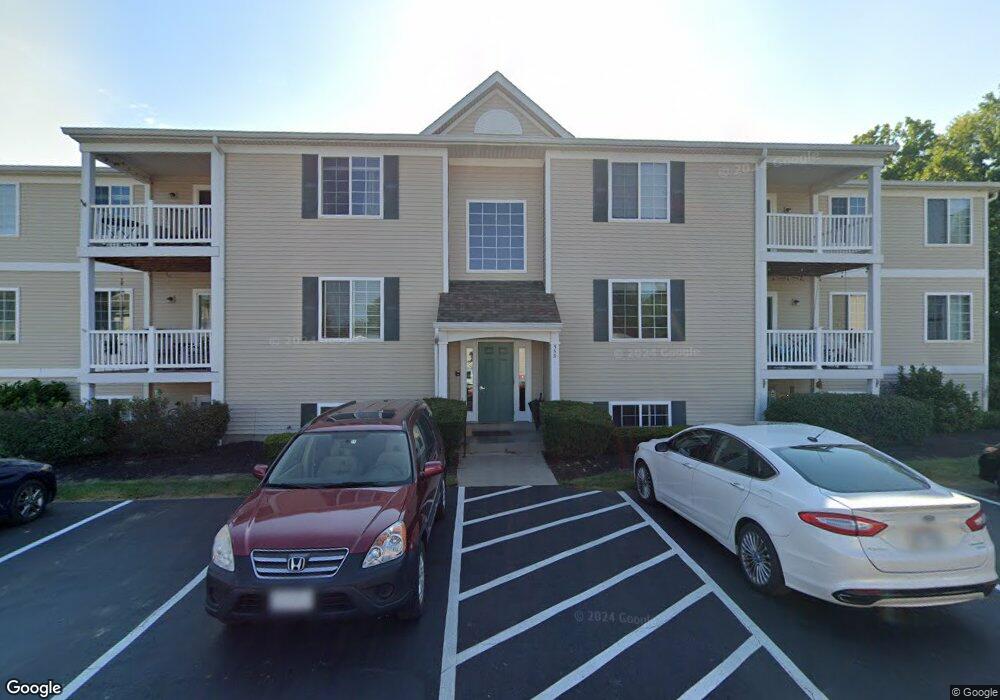
555 Aspen Glen Dr Unit 712 Cincinnati, OH 45244
Summerside NeighborhoodEstimated Value: $166,000 - $190,000
2
Beds
2
Baths
1,360
Sq Ft
$133/Sq Ft
Est. Value
About This Home
This home is located at 555 Aspen Glen Dr Unit 712, Cincinnati, OH 45244 and is currently estimated at $180,818, approximately $132 per square foot. 555 Aspen Glen Dr Unit 712 is a home located in Clermont County with nearby schools including Summerside Elementary School, West Clermont Middle School, and West Clermont High School.
Ownership History
Date
Name
Owned For
Owner Type
Purchase Details
Closed on
Apr 1, 2005
Sold by
Jang Suk and Jang Soon
Bought by
Shrader Gay
Current Estimated Value
Home Financials for this Owner
Home Financials are based on the most recent Mortgage that was taken out on this home.
Original Mortgage
$22,500
Interest Rate
5.89%
Mortgage Type
Fannie Mae Freddie Mac
Purchase Details
Closed on
Jun 30, 1998
Sold by
Reed Mark A
Bought by
Jang Suk Soon
Home Financials for this Owner
Home Financials are based on the most recent Mortgage that was taken out on this home.
Original Mortgage
$68,000
Interest Rate
7.27%
Mortgage Type
New Conventional
Purchase Details
Closed on
May 7, 1996
Sold by
Ryan/Andres Venture I
Bought by
Mark A Reed
Home Financials for this Owner
Home Financials are based on the most recent Mortgage that was taken out on this home.
Original Mortgage
$43,050
Interest Rate
6.88%
Mortgage Type
New Conventional
Create a Home Valuation Report for This Property
The Home Valuation Report is an in-depth analysis detailing your home's value as well as a comparison with similar homes in the area
Home Values in the Area
Average Home Value in this Area
Purchase History
| Date | Buyer | Sale Price | Title Company |
|---|---|---|---|
| Shrader Gay | $86,000 | -- | |
| Jang Suk Soon | $85,000 | -- | |
| Mark A Reed | $83,050 | -- |
Source: Public Records
Mortgage History
| Date | Status | Borrower | Loan Amount |
|---|---|---|---|
| Closed | Shrader Gay | $22,500 | |
| Previous Owner | Jang Suk Soon | $68,000 | |
| Previous Owner | Mark A Reed | $43,050 |
Source: Public Records
Tax History Compared to Growth
Tax History
| Year | Tax Paid | Tax Assessment Tax Assessment Total Assessment is a certain percentage of the fair market value that is determined by local assessors to be the total taxable value of land and additions on the property. | Land | Improvement |
|---|---|---|---|---|
| 2024 | $1,998 | $49,420 | $3,640 | $45,780 |
| 2023 | $2,033 | $49,420 | $3,640 | $45,780 |
| 2022 | $1,419 | $33,110 | $2,450 | $30,660 |
| 2021 | $1,425 | $33,110 | $2,450 | $30,660 |
| 2020 | $1,427 | $33,110 | $2,450 | $30,660 |
| 2019 | $556 | $19,850 | $2,210 | $17,640 |
| 2018 | $1,004 | $19,850 | $2,210 | $17,640 |
| 2017 | $887 | $6,620 | $2,210 | $4,410 |
| 2016 | $887 | $15,860 | $1,750 | $14,110 |
| 2015 | $861 | $15,860 | $1,750 | $14,110 |
| 2014 | $860 | $15,860 | $1,750 | $14,110 |
| 2013 | $1,202 | $21,920 | $1,930 | $19,990 |
Source: Public Records
Map
Nearby Homes
- 548 Aspen Glen Dr
- 1005 Steamboat Dr
- 533 Aspen Glen Dr
- 1041 Steamboat Dr
- 529 Aspen Glen Dr
- 1236 Arapaho Ln
- 822 Blackcomb Dr
- 860 Blackcomb Dr
- 4613 Laurel View Dr
- 4723 Brookfield Ct
- 499 Halifax Cir
- 4641 Clayton Dr
- 4603 Laurel View Dr
- 439 Dartmouth Cir
- 4530 Summerside Rd
- 4633 Summerside Rd
- 473 Richard Ln
- 481 Big Moe Dr
- 4669 Bluejacket Rd
- 4771 Klatte Rd
- 555 Aspen Glen Dr Unit 709
- 555 Aspen Glen Dr
- 555 Aspen Glen Dr
- 555 Aspen Glen Dr
- 555 Aspen Glen Dr
- 555 Aspen Glen Dr
- 555 Aspen Glen Dr
- 555 Aspen Glen Dr Unit 705
- 555 Aspen Glen Dr Unit 704
- 555 Aspen Glen Dr
- 555 Aspen Glen Dr Unit 702
- 555 Aspen Glen Dr
- 555 Aspen Glen Dr
- 555 Aspen Glen Dr Unit 807
- 555 Aspen Glen Dr
- 555 Aspen Glen Dr Unit 712
- 555 Aspen Glen Dr
- 555 Aspen Glen Dr
- 555 Aspen Glen Dr Unit 702
- 555 Aspen Glen Dr