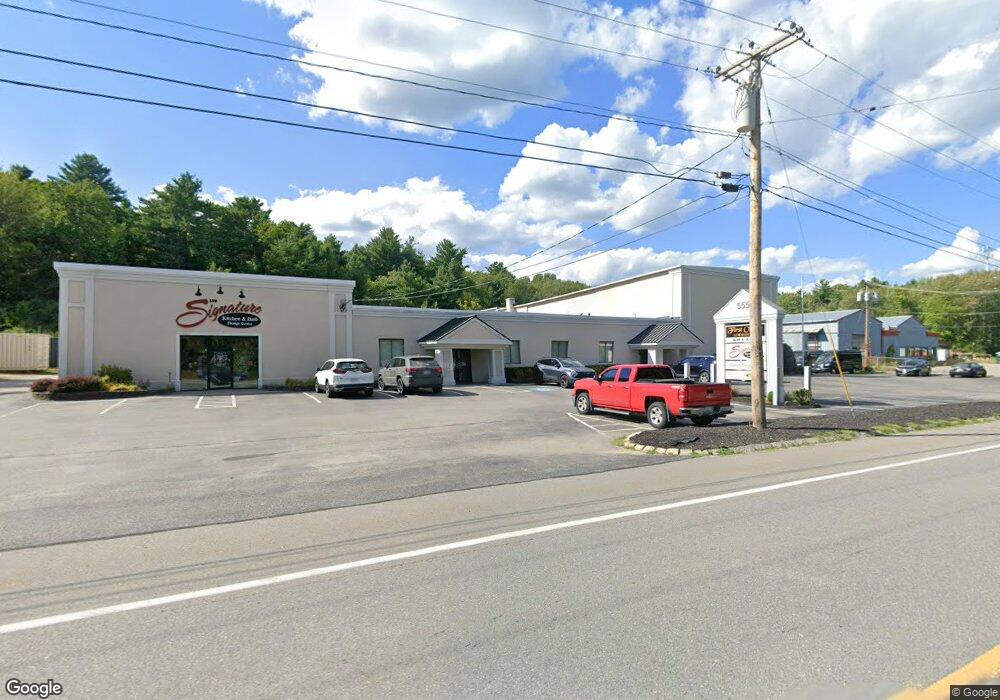
555 Chase Rd Lunenburg, MA 01462
Estimated Value: $1,014,210
3
Beds
1
Bath
14,591
Sq Ft
$70/Sq Ft
Est. Value
About This Home
This home is located at 555 Chase Rd, Lunenburg, MA 01462 and is currently estimated at $1,014,210, approximately $69 per square foot. 555 Chase Rd is a home located in Worcester County with nearby schools including Lunenburg Primary School, Lunenburg High School, and St Bernards Elementary School.
Ownership History
Date
Name
Owned For
Owner Type
Purchase Details
Closed on
Aug 25, 2016
Sold by
Bettencourt Daniel and Bettencourt Sabina
Bought by
First Choice Rt and Bettencourt
Current Estimated Value
Purchase Details
Closed on
Apr 11, 2006
Sold by
Bettencourt Exchange T and Exchange Authority Llp
Bought by
Bettencourt Daniel and Bettencourt Sabina
Purchase Details
Closed on
Jan 19, 2006
Sold by
Fanelli John J
Bought by
Bettencourt Exchange T and Exchange Authority Llp
Home Financials for this Owner
Home Financials are based on the most recent Mortgage that was taken out on this home.
Original Mortgage
$550,000
Interest Rate
6.33%
Mortgage Type
Commercial
Purchase Details
Closed on
Sep 23, 1999
Sold by
Bert Ret and Boutotte Rene A
Bought by
Lehtola David A
Purchase Details
Closed on
Dec 19, 1997
Sold by
Em Rt
Bought by
Bert Real Est Trust
Create a Home Valuation Report for This Property
The Home Valuation Report is an in-depth analysis detailing your home's value as well as a comparison with similar homes in the area
Home Values in the Area
Average Home Value in this Area
Purchase History
| Date | Buyer | Sale Price | Title Company |
|---|---|---|---|
| First Choice Rt | -- | -- | |
| First Choice Rt | -- | -- | |
| Bettencourt Daniel | -- | -- | |
| Bettencourt Daniel | -- | -- | |
| Bettencourt Exchange T | $550,000 | -- | |
| Bettencourt Exchange T | $550,000 | -- | |
| Lehtola David A | $450,000 | -- | |
| Bert Real Est Trust | $435,000 | -- | |
| Bert Real Est Trust | $435,000 | -- |
Source: Public Records
Mortgage History
| Date | Status | Borrower | Loan Amount |
|---|---|---|---|
| Previous Owner | Bettencourt Exchange T | $550,000 | |
| Previous Owner | Bert Real Est Trust | $27,458 | |
| Previous Owner | Bert Real Est Trust | $60,000 |
Source: Public Records
Tax History Compared to Growth
Tax History
| Year | Tax Paid | Tax Assessment Tax Assessment Total Assessment is a certain percentage of the fair market value that is determined by local assessors to be the total taxable value of land and additions on the property. | Land | Improvement |
|---|---|---|---|---|
| 2025 | $9,231 | $642,800 | $198,800 | $444,000 |
| 2024 | $8,906 | $631,600 | $187,600 | $444,000 |
| 2023 | $8,946 | $611,900 | $177,600 | $434,300 |
| 2022 | $10,519 | $611,900 | $177,600 | $434,300 |
| 2020 | $9,723 | $536,600 | $177,600 | $359,000 |
| 2019 | $10,024 | $536,600 | $177,600 | $359,000 |
| 2018 | $8,548 | $433,900 | $95,600 | $338,300 |
| 2017 | $8,669 | $433,900 | $95,600 | $338,300 |
| 2016 | $8,509 | $433,900 | $95,600 | $338,300 |
| 2015 | $8,414 | $459,300 | $95,600 | $363,700 |
Source: Public Records
Map
Nearby Homes
- 507/533R W Townsend Rd
- 691 Chase Rd
- 12 W Townsend Rd
- 759 Northfield Rd
- 756 Northfield Rd
- 481 W Townsend Rd
- 8 Country Rd
- 319 Highland St
- 63 Holman St
- 130 Gilchrest St
- 9 Sequoia Dr
- 711 Massachusetts Ave Unit 2
- 711 Massachusetts Ave Unit 4
- 51 Old City Rd
- 73 Royal Fern Dr
- 1083 Northfield Rd
- 1178 Northfield Rd
- 830 Massachusetts Ave
- 6 Riley Rd Unit 6
- 0 Tyler Rd Unit 72560808
- 571 Chase Rd
- 539 Chase Rd
- 172 W Townsend Rd
- 180 Chase Rd
- 156 W Townsend Rd
- Lot 1 Chase Rd
- Lot R Chase Rd
- 181 W Townsend Rd
- 146 W Townsend Rd
- 151 W Townsend Rd
- 222 W Townsend Rd
- 203 W Townsend Rd
- 189 W Townsend Rd
- 227 W Townsend Rd
- 480 Chase Rd
- 262 W Townsend Rd
- 477 Chase Rd
- 233 W Townsend Rd
- 110 W Townsend Rd
- 112 W Townsend Rd