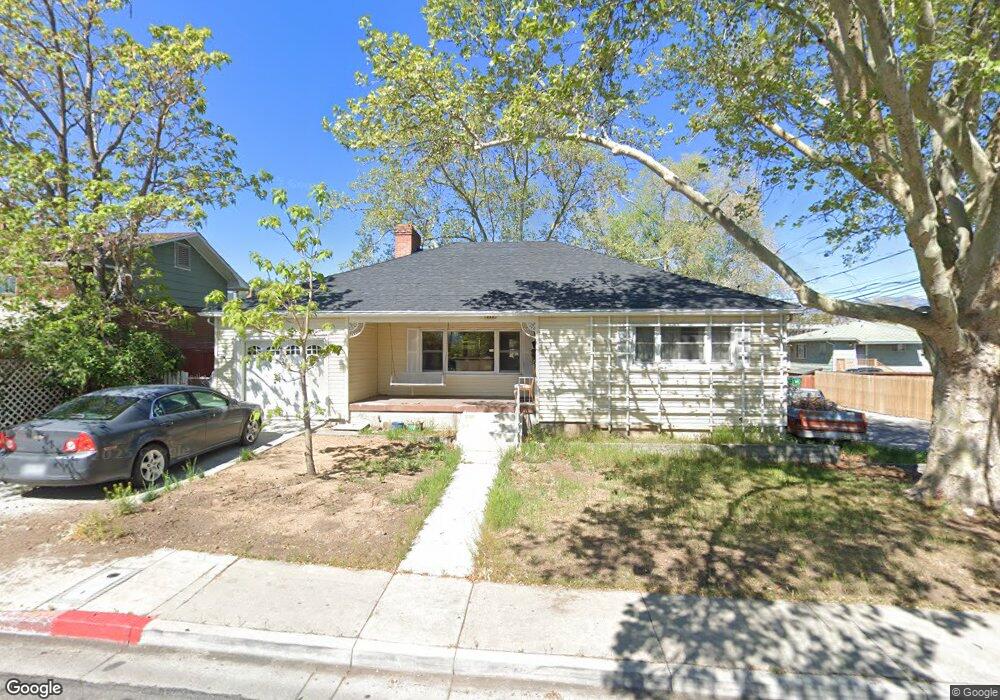
555 Kirman Ave Reno, NV 89502
Wells Avenue District NeighborhoodEstimated Value: $427,674 - $559,000
4
Beds
2
Baths
1,324
Sq Ft
$375/Sq Ft
Est. Value
About This Home
This home is located at 555 Kirman Ave, Reno, NV 89502 and is currently estimated at $495,919, approximately $374 per square foot. 555 Kirman Ave is a home located in Washoe County with nearby schools including Libby C Booth Elementary School, Vaughn Middle School, and Earl Wooster High School.
Ownership History
Date
Name
Owned For
Owner Type
Purchase Details
Closed on
Mar 14, 2005
Sold by
Shirley Barbara F
Bought by
Shirley Barbara F and Shirley Living Trust
Current Estimated Value
Purchase Details
Closed on
Apr 18, 2000
Sold by
Shirley Robert M and Shirley Barbara F
Bought by
Shirley Robert M and Shirley Barbara F
Purchase Details
Closed on
Dec 17, 1994
Sold by
Nattuci Domenico
Bought by
Natucci Nattuci Domenico and Natucci Reynolds Assunta
Create a Home Valuation Report for This Property
The Home Valuation Report is an in-depth analysis detailing your home's value as well as a comparison with similar homes in the area
Home Values in the Area
Average Home Value in this Area
Purchase History
| Date | Buyer | Sale Price | Title Company |
|---|---|---|---|
| Shirley Barbara F | -- | -- | |
| Shirley Robert M | -- | -- | |
| Natucci Nattuci Domenico | -- | -- |
Source: Public Records
Tax History Compared to Growth
Tax History
| Year | Tax Paid | Tax Assessment Tax Assessment Total Assessment is a certain percentage of the fair market value that is determined by local assessors to be the total taxable value of land and additions on the property. | Land | Improvement |
|---|---|---|---|---|
| 2025 | $931 | $59,776 | $34,265 | $25,511 |
| 2024 | $931 | $58,153 | $33,040 | $25,113 |
| 2023 | $904 | $56,559 | $33,390 | $23,169 |
| 2022 | $2,935 | $46,759 | $27,825 | $18,934 |
| 2021 | $864 | $36,740 | $18,270 | $18,470 |
| 2020 | $836 | $37,247 | $19,040 | $18,207 |
| 2019 | $805 | $33,773 | $16,660 | $17,113 |
| 2018 | $783 | $28,450 | $12,005 | $16,445 |
| 2017 | $762 | $26,569 | $10,430 | $16,139 |
| 2016 | $752 | $25,271 | $9,275 | $15,996 |
| 2015 | $756 | $23,363 | $7,350 | $16,013 |
| 2014 | $734 | $20,440 | $5,250 | $15,190 |
| 2013 | -- | $18,754 | $4,025 | $14,729 |
Source: Public Records
Map
Nearby Homes
- 785 Roberts St Unit 795B
- 785 Roberts St
- 751 Roberts St
- 525 Kirman Ave
- 505 Kirman Ave
- 782 Moran St
- 749 Roberts St
- 580 Kirman Ave
- 796 & 798 Moran St
- 798 Moran St
- 747 Roberts St
- 780 Moran St
- 774 Moran St
- 805 Roberts St
- 805 Roberts St Unit A
- 805 Roberts Street #A (Upstairs Unit)
- 815 Roberts St
- 790 Roberts St
- 760 Moran St Unit D
- 737 Roberts St