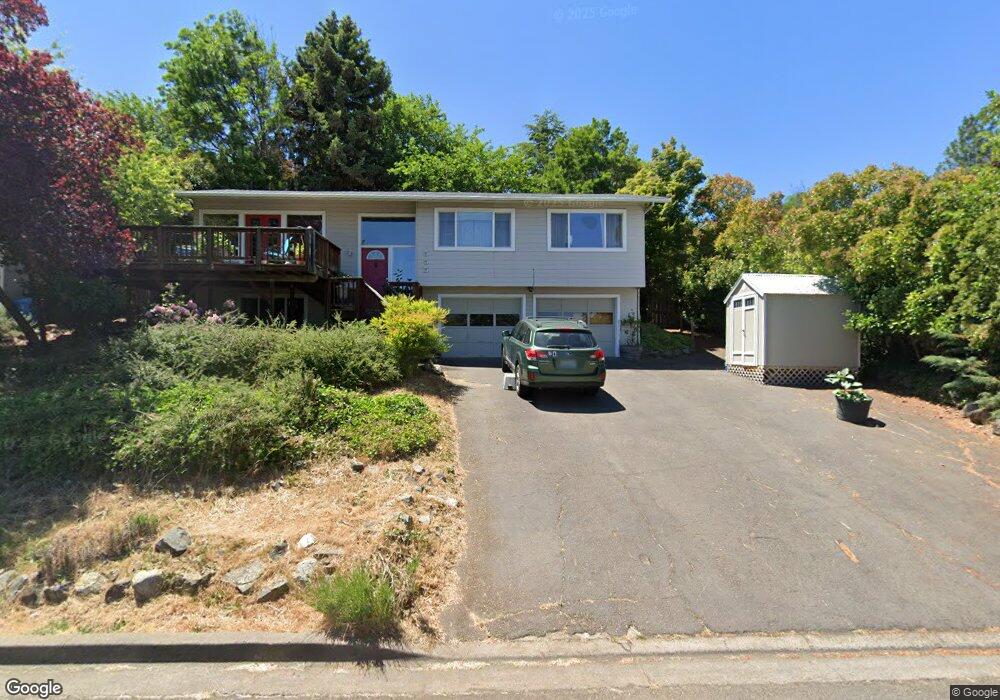
555 Maple Way Ashland, OR 97520
North Ashland NeighborhoodEstimated Value: $462,000 - $546,000
4
Beds
3
Baths
1,789
Sq Ft
$281/Sq Ft
Est. Value
About This Home
This home is located at 555 Maple Way, Ashland, OR 97520 and is currently estimated at $501,886, approximately $280 per square foot. 555 Maple Way is a home located in Jackson County with nearby schools including Helman Elementary School, Ashland Middle School, and Ashland High School.
Ownership History
Date
Name
Owned For
Owner Type
Purchase Details
Closed on
May 4, 2015
Sold by
Lundquist Susan K
Bought by
Skl & Asl Llc
Current Estimated Value
Purchase Details
Closed on
Oct 4, 2004
Sold by
Bittner Daniel and Bittner Doreen
Bought by
Lundquist Virginia A and The Lindquist Family Trust
Purchase Details
Closed on
Mar 3, 2004
Sold by
Jill Cobb P Bradford and Jill Celestskye
Bought by
Bittner Daniel and Bittner Doreen
Home Financials for this Owner
Home Financials are based on the most recent Mortgage that was taken out on this home.
Original Mortgage
$175,000
Interest Rate
5.65%
Mortgage Type
Unknown
Purchase Details
Closed on
Feb 7, 2000
Sold by
Cahill Wayne R
Bought by
Jill Cobb P Bradford and Jill Celestskye
Home Financials for this Owner
Home Financials are based on the most recent Mortgage that was taken out on this home.
Original Mortgage
$213,210
Interest Rate
10.37%
Create a Home Valuation Report for This Property
The Home Valuation Report is an in-depth analysis detailing your home's value as well as a comparison with similar homes in the area
Home Values in the Area
Average Home Value in this Area
Purchase History
| Date | Buyer | Sale Price | Title Company |
|---|---|---|---|
| Skl & Asl Llc | -- | None Available | |
| Lundquist Virginia A | -- | -- | |
| Bittner Daniel | $357,500 | Lawyers Title Ins | |
| Jill Cobb P Bradford | $236,900 | Jackson County Title |
Source: Public Records
Mortgage History
| Date | Status | Borrower | Loan Amount |
|---|---|---|---|
| Previous Owner | Bittner Daniel | $175,000 | |
| Previous Owner | Jill Cobb P Bradford | $213,210 |
Source: Public Records
Tax History
| Year | Tax Paid | Tax Assessment Tax Assessment Total Assessment is a certain percentage of the fair market value that is determined by local assessors to be the total taxable value of land and additions on the property. | Land | Improvement |
|---|---|---|---|---|
| 2026 | $5,204 | $332,380 | $198,000 | $134,380 |
| 2025 | $5,094 | $328,590 | $181,160 | $147,430 |
| 2024 | $5,094 | $319,020 | $175,880 | $143,140 |
| 2023 | $4,929 | $309,730 | $170,760 | $138,970 |
| 2022 | $4,770 | $309,730 | $170,760 | $138,970 |
| 2021 | $4,608 | $300,710 | $165,790 | $134,920 |
| 2020 | $4,479 | $291,960 | $160,970 | $130,990 |
| 2019 | $4,408 | $275,210 | $151,740 | $123,470 |
| 2018 | $4,164 | $267,200 | $147,330 | $119,870 |
| 2017 | $4,134 | $267,200 | $147,330 | $119,870 |
| 2016 | $4,026 | $251,870 | $138,880 | $112,990 |
| 2015 | $3,871 | $251,870 | $138,880 | $112,990 |
| 2014 | $3,745 | $237,420 | $130,920 | $106,500 |
Source: Public Records
Map
Nearby Homes
- 527 Chestnut St
- 495 Chestnut St Unit 23
- 347 Wimer St
- 369 Alta Ave
- 400 Fernwood Dr
- 563 Rock St & 152 Maple St
- 730 Grover St
- 563 Rock and 152 Maple St
- 668 N Main St
- 0 Pape St
- 500 Lakota Way
- 319 West St
- 566 Coffee Ln
- 290 Skycrest Dr
- 381 Glenn St
- 454 Lori Ln
- 583 Coffee Ln
- 692 Vansant St
- 372 Glenn St
- 283 High St
- 565 Maple Way
- 545 Maple Way
- 551 Walnut St
- 531 Maple Way
- 360 Maple St
- 550 Maple Way
- 381 Maple St
- 588 Walnut St
- 563 Walnut St
- 539 Walnut St
- 540 Maple Way
- 367 Maple St
- 527 Walnut St
- 0 Walnut St Unit 100244139
- 0 Walnut St Unit 220153992
- 515 Maple Way
- 345 Maple St
- 350 Wiley St
- 601 Walnut St
- 605 Walnut St
Your Personal Tour Guide
Ask me questions while you tour the home.