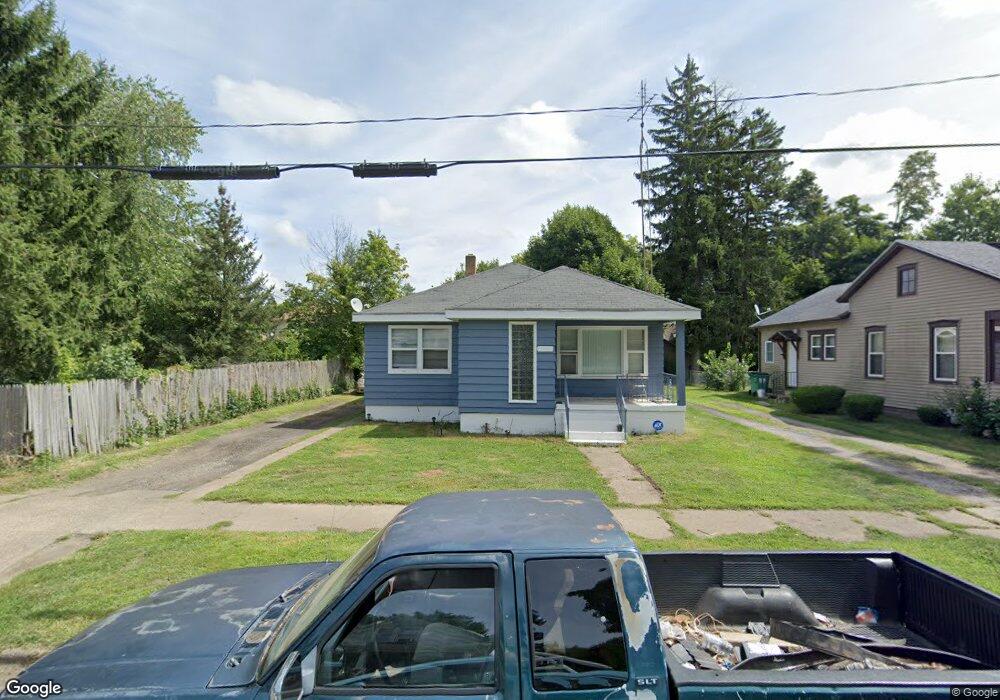
555 Pearl St Benton Harbor, MI 49022
Estimated Value: $111,000 - $173,000
2
Beds
1
Bath
1,344
Sq Ft
$98/Sq Ft
Est. Value
About This Home
This home is located at 555 Pearl St, Benton Harbor, MI 49022 and is currently estimated at $131,454, approximately $97 per square foot. 555 Pearl St is a home located in Berrien County with nearby schools including Fair Plain Middle School, Benton Harbor High School, and Benton Harbor Charter School Academy.
Ownership History
Date
Name
Owned For
Owner Type
Purchase Details
Closed on
Mar 20, 2025
Sold by
Johnson Ernest and Ware Latasha
Bought by
Johnson Ernest
Current Estimated Value
Purchase Details
Closed on
Jun 17, 2024
Sold by
Johnson Ernest and Ware Latasha
Bought by
Berrien County Treasurer
Purchase Details
Closed on
Jun 13, 2023
Sold by
Johnson Ernest and Ware Latasha
Bought by
Berrien County Treasurer
Purchase Details
Closed on
Aug 26, 2021
Sold by
Johnson Ernest
Bought by
Johnson Ernest and Ware Latasha
Purchase Details
Closed on
Dec 17, 2018
Sold by
Johnson Louise
Bought by
Johnson Ernest
Purchase Details
Closed on
Oct 8, 2017
Sold by
Johnson Ernest
Bought by
Johnson Louis
Purchase Details
Closed on
Aug 29, 2017
Sold by
Witkowski Bret
Bought by
Johnson Ernest
Purchase Details
Closed on
Jun 13, 1984
Purchase Details
Closed on
Mar 27, 1974
Create a Home Valuation Report for This Property
The Home Valuation Report is an in-depth analysis detailing your home's value as well as a comparison with similar homes in the area
Home Values in the Area
Average Home Value in this Area
Purchase History
| Date | Buyer | Sale Price | Title Company |
|---|---|---|---|
| Johnson Ernest | -- | None Listed On Document | |
| Johnson Ernest | -- | None Listed On Document | |
| Berrien County Treasurer | -- | -- | |
| Berrien County Treasurer | -- | -- | |
| Johnson Ernest | -- | None Available | |
| Johnson Ernest | -- | None Available | |
| Johnson Louis | -- | None Available | |
| Johnson Ernest | $9,500 | Attorney | |
| -- | $14,000 | -- | |
| -- | $14,000 | -- |
Source: Public Records
Tax History Compared to Growth
Tax History
| Year | Tax Paid | Tax Assessment Tax Assessment Total Assessment is a certain percentage of the fair market value that is determined by local assessors to be the total taxable value of land and additions on the property. | Land | Improvement |
|---|---|---|---|---|
| 2025 | $1,079 | $53,100 | $0 | $0 |
| 2024 | $864 | $40,700 | $0 | $0 |
| 2023 | $691 | $18,600 | $0 | $0 |
| 2022 | $784 | $13,500 | $0 | $0 |
| 2021 | $1,691 | $13,200 | $800 | $12,400 |
| 2020 | $749 | $13,200 | $0 | $0 |
| 2019 | $1,091 | $11,700 | $0 | $0 |
| 2018 | $773 | $12,000 | $0 | $0 |
| 2017 | $1,232 | $19,600 | $0 | $0 |
| 2016 | $1,787 | $19,800 | $0 | $0 |
| 2015 | $1,782 | $19,100 | $0 | $0 |
| 2014 | $843 | $23,100 | $0 | $0 |
Source: Public Records
Map
Nearby Homes
- 416 E Britain Ave
- 614 Pavone St
- 378 Pipestone St
- 391 Pipestone St
- 161 Kline Ave
- 730 Superior St
- 1045 Broadway
- 576 Colfax Ave
- 460 Colfax Ave
- 694 Colfax Ave
- 833 Pearl St
- 131 Clay St
- 309 High St
- 349 E Empire Ave
- 872 Mcalister Ave
- 255 High St
- 171 E Empire Ave
- 419 Packard St
- VL Eighth Ninth Boughton St
- 972 Pearl St