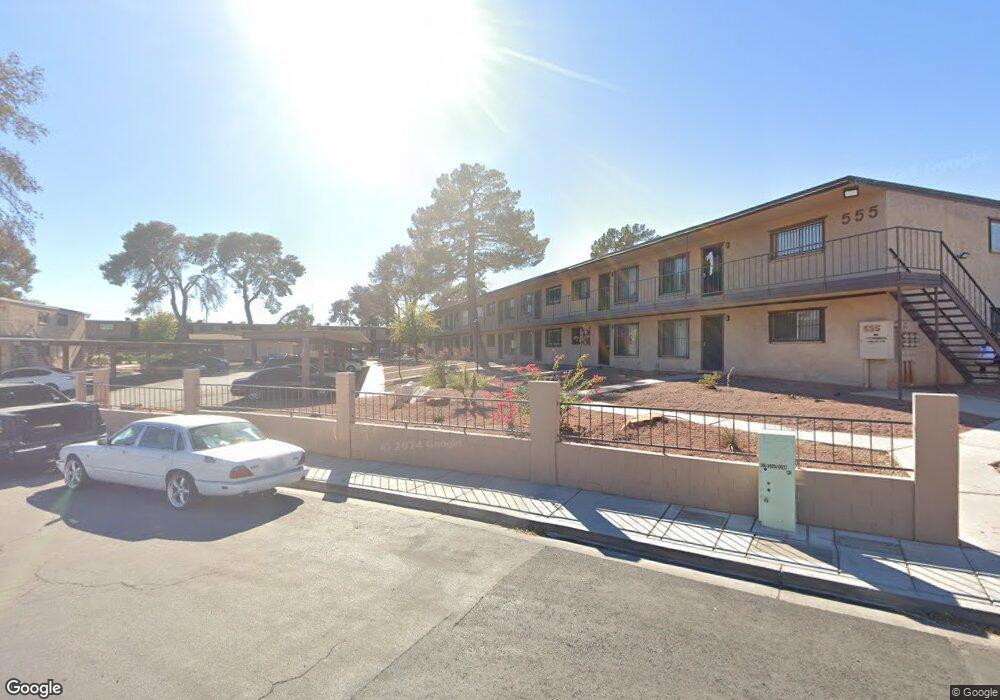
555 S Royal Crest Cir Unit 21 Las Vegas, NV 89169
University District NeighborhoodEstimated Value: $136,775 - $148,000
2
Beds
1
Bath
816
Sq Ft
$175/Sq Ft
Est. Value
About This Home
This home is located at 555 S Royal Crest Cir Unit 21, Las Vegas, NV 89169 and is currently estimated at $142,694, approximately $174 per square foot. 555 S Royal Crest Cir Unit 21 is a home located in Clark County with nearby schools including Dean Petersen Elementary School, William E. Orr Middle School, and Valley High School.
Ownership History
Date
Name
Owned For
Owner Type
Purchase Details
Closed on
Feb 21, 2018
Sold by
Kanda Kichi
Bought by
Kanda Robert Haruo and Kanda James Kiyoshi
Current Estimated Value
Purchase Details
Closed on
Sep 11, 1998
Sold by
Bahnan Layla
Bought by
Bahnan Joe A
Purchase Details
Closed on
Jan 24, 1997
Sold by
Dallin Jacklyn J
Bought by
Chung Oon Bo and Chung Young Ok
Home Financials for this Owner
Home Financials are based on the most recent Mortgage that was taken out on this home.
Original Mortgage
$135,000
Outstanding Balance
$15,289
Interest Rate
7.58%
Mortgage Type
Seller Take Back
Estimated Equity
$127,405
Purchase Details
Closed on
Aug 8, 1995
Sold by
Knott Lamar W and Knott Alma M
Bought by
Kanda Ronald S and Kanda Kicki
Create a Home Valuation Report for This Property
The Home Valuation Report is an in-depth analysis detailing your home's value as well as a comparison with similar homes in the area
Home Values in the Area
Average Home Value in this Area
Purchase History
| Date | Buyer | Sale Price | Title Company |
|---|---|---|---|
| Kanda Robert Haruo | -- | None Available | |
| Bahnan Joe A | -- | United Title | |
| Chung Oon Bo | $185,000 | First American Title Co | |
| Kanda Ronald S | $45,000 | Land Title |
Source: Public Records
Mortgage History
| Date | Status | Borrower | Loan Amount |
|---|---|---|---|
| Open | Chung Oon Bo | $135,000 |
Source: Public Records
Tax History Compared to Growth
Tax History
| Year | Tax Paid | Tax Assessment Tax Assessment Total Assessment is a certain percentage of the fair market value that is determined by local assessors to be the total taxable value of land and additions on the property. | Land | Improvement |
|---|---|---|---|---|
| 2025 | $232 | $17,276 | $9,240 | $8,036 |
| 2024 | $226 | $17,276 | $9,240 | $8,036 |
| 2023 | $226 | $20,496 | $13,440 | $7,056 |
| 2022 | $222 | $17,697 | $11,340 | $6,357 |
| 2021 | $259 | $16,527 | $10,500 | $6,027 |
| 2020 | $249 | $14,267 | $8,400 | $5,867 |
| 2019 | $241 | $13,262 | $7,560 | $5,702 |
| 2018 | $234 | $10,902 | $5,460 | $5,442 |
| 2017 | $295 | $10,065 | $4,620 | $5,445 |
| 2016 | $224 | $9,286 | $4,200 | $5,086 |
| 2015 | $221 | $7,806 | $2,940 | $4,866 |
| 2014 | $215 | $7,111 | $2,100 | $5,011 |
Source: Public Records
Map
Nearby Homes
- 565 S Royal Crest Cir Unit 19
- 585 S Royal Crest Cir Unit 20
- 585 S Royal Crest Cir Unit 13
- 575 S Royal Crest Cir Unit 26
- 555 S Royal Crest Cir Unit 2
- 3712 Royal Crest St Unit 14
- 3720 Royal Crest St Unit 4
- 3720 Royal Crest St Unit 16 & 17
- 3720 Royal Crest St Unit 6
- 595 S Royal Crest Cir Unit 20
- 605 S Royal Crest Cir Unit 8
- 605 S Royal Crest Cir Unit 9
- 3719 Hazelwood St Unit 16
- 730 S Royal Crest Cir Unit 426
- 730 S Royal Crest Cir Unit 421
- 730 S Royal Crest Cir Unit CIR414
- 3727 Hazelwood St Unit 12
- 615 S Royal Crest Cir Unit 8
- 615 S Royal Crest Cir Unit 10
- 540 Elm Dr Unit 104
- 555 S Royal Crest Cir Unit 3
- 555 S Royal Crest Cir
- 555 S Royal Crest Cir Unit 25
- 555 S Royal Crest Cir Unit 20
- 555 S Royal Crest Cir Unit 5
- 555 S Royal Crest Cir Unit 7
- 555 S Royal Crest Cir Unit 4
- 555 S Royal Crest Cir Unit 14
- 555 S Royal Crest Cir Unit 28
- 555 S Royal Crest Cir Unit 11
- 555 S Royal Crest Cir Unit 10
- 555 S Royal Crest Cir Unit 18
- 555 S Royal Crest Cir Unit 16
- 555 S Royal Crest Cir Unit 27
- 555 S Royal Crest Cir Unit 23
- 555 S Royal Crest Cir Unit 9
- 555 S Royal Crest Cir Unit 8
- 555 S Royal Crest Cir Unit 19
- 555 S Royal Crest Cir Unit 15
- 555 S Royal Crest Cir Unit 1