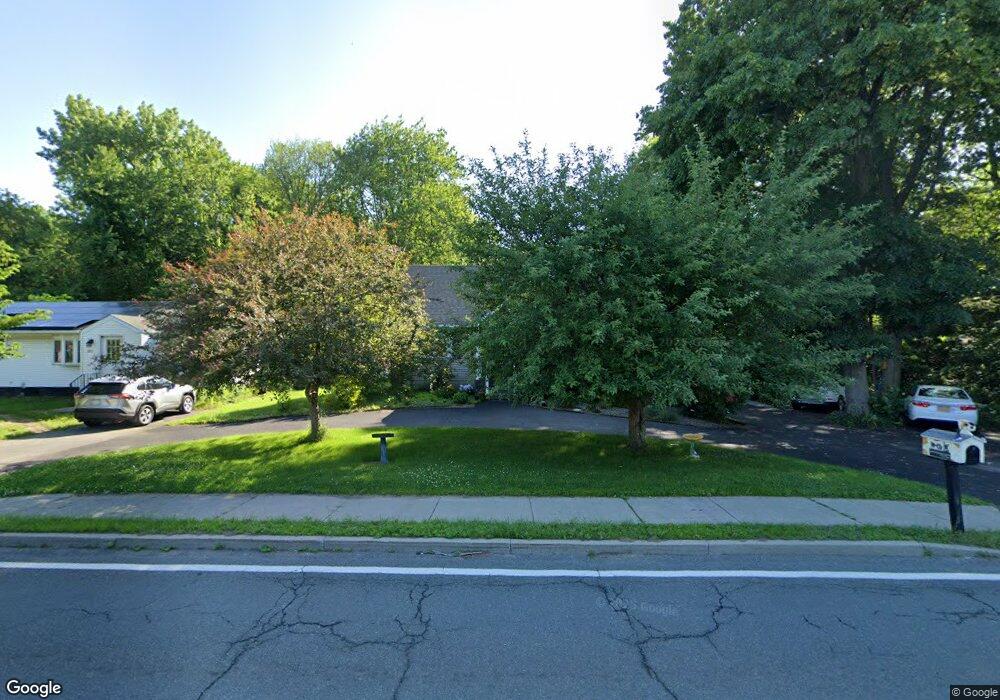
555 Sand Creek Rd Albany, NY 12205
Estimated Value: $289,000 - $427,000
4
Beds
2
Baths
1,428
Sq Ft
$252/Sq Ft
Est. Value
About This Home
This home is located at 555 Sand Creek Rd, Albany, NY 12205 and is currently estimated at $359,801, approximately $251 per square foot. 555 Sand Creek Rd is a home located in Albany County with nearby schools including Forest Park Elementary School, Sand Creek Middle School, and Colonie Central High School.
Ownership History
Date
Name
Owned For
Owner Type
Purchase Details
Closed on
Feb 14, 2013
Sold by
Belus John and Roberts Margaret A
Bought by
United States
Current Estimated Value
Home Financials for this Owner
Home Financials are based on the most recent Mortgage that was taken out on this home.
Original Mortgage
$80,000
Outstanding Balance
$55,976
Interest Rate
3.43%
Mortgage Type
Purchase Money Mortgage
Estimated Equity
$303,825
Purchase Details
Closed on
Apr 22, 1999
Home Financials for this Owner
Home Financials are based on the most recent Mortgage that was taken out on this home.
Original Mortgage
$74,642
Interest Rate
6.95%
Mortgage Type
FHA
Purchase Details
Closed on
Nov 18, 1998
Purchase Details
Closed on
Nov 17, 1998
Sold by
Anostario Joseph M and Knowles Shelly
Bought by
Federal Home Loan Mortgage Corporation
Create a Home Valuation Report for This Property
The Home Valuation Report is an in-depth analysis detailing your home's value as well as a comparison with similar homes in the area
Home Values in the Area
Average Home Value in this Area
Purchase History
| Date | Buyer | Sale Price | Title Company |
|---|---|---|---|
| United States | $6,000 | None Available | |
| -- | $93,000 | -- | |
| -- | $90,000 | -- | |
| Federal Home Loan Mortgage Corporation | $90,000 | -- |
Source: Public Records
Mortgage History
| Date | Status | Borrower | Loan Amount |
|---|---|---|---|
| Open | United States | $80,000 | |
| Previous Owner | -- | $74,642 |
Source: Public Records
Tax History Compared to Growth
Tax History
| Year | Tax Paid | Tax Assessment Tax Assessment Total Assessment is a certain percentage of the fair market value that is determined by local assessors to be the total taxable value of land and additions on the property. | Land | Improvement |
|---|---|---|---|---|
| 2024 | $4,738 | $117,900 | $29,500 | $88,400 |
| 2023 | $4,606 | $117,900 | $29,500 | $88,400 |
| 2022 | $4,566 | $117,900 | $29,500 | $88,400 |
| 2021 | $4,497 | $117,900 | $29,500 | $88,400 |
| 2020 | $3,904 | $117,900 | $29,500 | $88,400 |
| 2019 | $2,650 | $117,900 | $29,500 | $88,400 |
| 2018 | $3,771 | $117,900 | $29,500 | $88,400 |
| 2017 | $0 | $117,900 | $29,500 | $88,400 |
| 2016 | $3,728 | $117,900 | $29,500 | $88,400 |
| 2015 | -- | $117,900 | $29,500 | $88,400 |
| 2014 | -- | $117,900 | $29,500 | $88,400 |
Source: Public Records
Map
Nearby Homes
- 559 Sand Creek Rd
- 88 Delafield Dr
- 557A Sand Creek Rd
- 564 Sand Creek Rd
- 4 Peter Dr
- 557 Sand Creek Rd
- 553E Sand Creek Rd
- 86 Delafield Dr
- 553D Sand Creek Rd
- 561 Sand Creek Rd
- 6 Peter Dr
- 553C Sand Creek Rd
- 1 Peter Dr
- 553B Sand Creek Rd
- 553F Sand Creek Rd
- 563 Sand Creek Rd
- 84 Delafield Dr
- 553A Sand Creek Rd
- 3 Peter Dr
- 8 Peter Dr