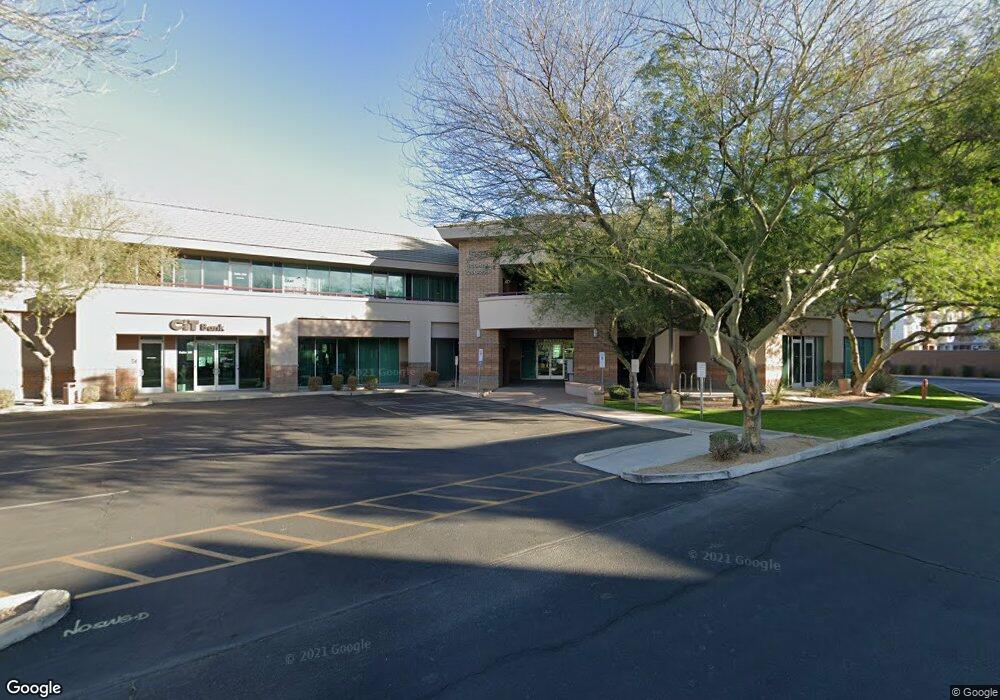
555 W Chandler Blvd Unit 200 Chandler, AZ 85225
Downtown Chandler NeighborhoodEstimated Value: $2,551,311
--
Bed
--
Bath
18,947
Sq Ft
$135/Sq Ft
Est. Value
About This Home
This home is located at 555 W Chandler Blvd Unit 200, Chandler, AZ 85225 and is currently estimated at $2,551,311, approximately $134 per square foot. 555 W Chandler Blvd Unit 200 is a home located in Maricopa County with nearby schools including San Marcos Elementary School, Bogle Junior High School, and St. Mary-Basha Catholic School.
Ownership History
Date
Name
Owned For
Owner Type
Purchase Details
Closed on
Jun 30, 2023
Sold by
Hfh Commercial Llc Series 1
Bought by
Mmth Llc
Current Estimated Value
Purchase Details
Closed on
Dec 28, 2009
Sold by
555 West Chandler Llc
Bought by
Hfh Commercial Llc Series 1
Home Financials for this Owner
Home Financials are based on the most recent Mortgage that was taken out on this home.
Original Mortgage
$1,650,000
Interest Rate
4.78%
Mortgage Type
Commercial
Purchase Details
Closed on
Sep 16, 2004
Sold by
Fairways Main Partners Llc
Bought by
555 West Chandler Llc
Purchase Details
Closed on
Oct 23, 2000
Sold by
Focus Development Corp
Bought by
Cook Joe L and Cook Debbie J
Home Financials for this Owner
Home Financials are based on the most recent Mortgage that was taken out on this home.
Original Mortgage
$965,000
Interest Rate
7.89%
Mortgage Type
Commercial
Create a Home Valuation Report for This Property
The Home Valuation Report is an in-depth analysis detailing your home's value as well as a comparison with similar homes in the area
Home Values in the Area
Average Home Value in this Area
Purchase History
| Date | Buyer | Sale Price | Title Company |
|---|---|---|---|
| Mmth Llc | $2,500,000 | None Listed On Document | |
| Hfh Commercial Llc Series 1 | $2,100,000 | Clear Title Agency Of Arizon | |
| 555 West Chandler Llc | $2,933,257 | Lawyers Title Of Arizona Inc | |
| Cook Joe L | $1,750,000 | Lawyers Title Of Arizona Inc |
Source: Public Records
Mortgage History
| Date | Status | Borrower | Loan Amount |
|---|---|---|---|
| Previous Owner | Hfh Commercial Llc Series 1 | $1,650,000 | |
| Previous Owner | Cook Joe L | $965,000 | |
| Closed | Cook Joe L | $370,000 |
Source: Public Records
Tax History Compared to Growth
Tax History
| Year | Tax Paid | Tax Assessment Tax Assessment Total Assessment is a certain percentage of the fair market value that is determined by local assessors to be the total taxable value of land and additions on the property. | Land | Improvement |
|---|---|---|---|---|
| 2025 | $13,159 | $138,678 | -- | -- |
| 2024 | $13,298 | $136,201 | -- | -- |
| 2023 | $13,298 | $299,982 | $59,993 | $239,989 |
| 2022 | $13,256 | $243,898 | $48,773 | $195,125 |
| 2021 | $14,015 | $233,334 | $46,656 | $186,678 |
| 2020 | $13,937 | $219,420 | $43,884 | $175,536 |
| 2019 | $13,448 | $175,806 | $35,154 | $140,652 |
| 2018 | $13,065 | $149,598 | $29,916 | $119,682 |
| 2017 | $12,275 | $136,206 | $27,234 | $108,972 |
| 2016 | $11,856 | $106,758 | $21,348 | $85,410 |
| 2015 | $11,684 | $98,439 | $19,684 | $78,755 |
Source: Public Records
Map
Nearby Homes
- 515 W Toledo St
- 121 N California St Unit 35
- 389 W Fairway Place
- 291 N Washington St
- 123 N Washington St Unit 26
- 518 N Cheri Lynn Dr
- 121 W Galveston St
- The Bower Plan at San Marcos
- Floor Plan 2 at San Marcos
- Floor Plan 1 at San Marcos
- 635 N Vine St
- 651 W Laredo St
- 644 N Vine St
- 161 E Erie St
- 640 W Laredo St
- 660 W Laredo St
- 726 S Nebraska St Unit 121
- 101 W Harrison St
- 630 W Saragosa St
- 501 N Delaware St
- 555 W Chandler Blvd Unit 205
- 555 W Chandler Blvd Unit 202
- 555 W Chandler Blvd Unit 205-206
- 555 W Chandler Blvd Unit 206
- 565 W Chandler Blvd Unit 115
- 565 W Chandler Blvd Unit 118
- 565 W Chandler Blvd Unit 210
- 565 W Chandler Blvd Unit 212
- 565 W Chandler Blvd Unit 216
- 500 W Chandler Blvd
- 540 W Chandler Blvd
- 542 W Chandler Blvd
- 498 W Chandler Blvd
- 484 W Chandler Blvd
- 501 W Toledo St
- 456 W Chandler Blvd
- 529 W Toledo St
- 499 W Toledo St
- 575 W Chandler Blvd Unit 127
- 557 W Toledo St