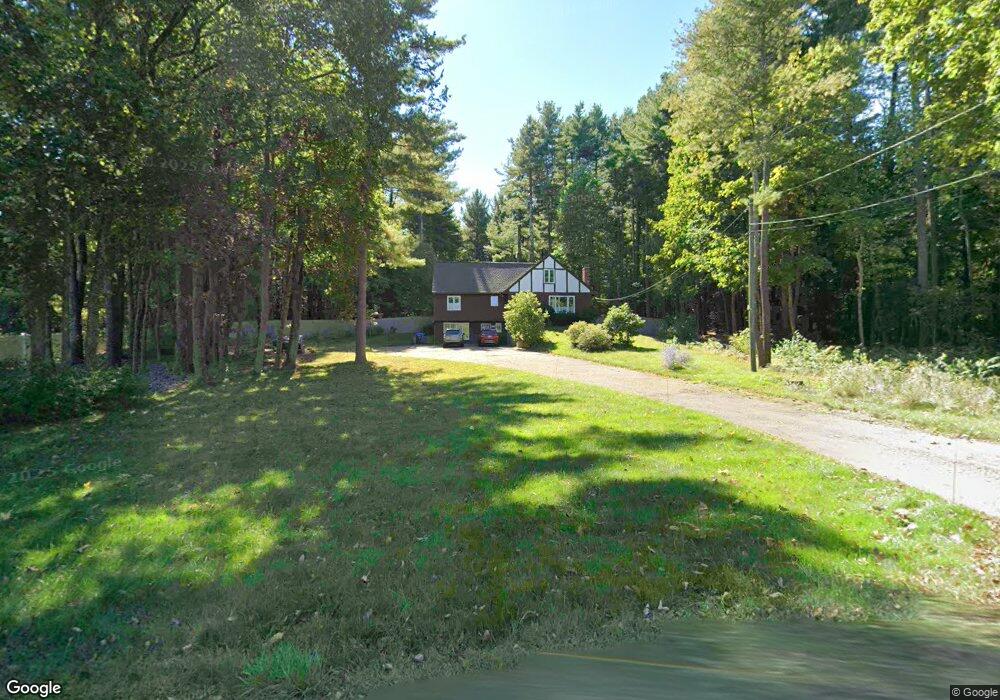
555 West St Wrentham, MA 02093
Sheldonville NeighborhoodEstimated Value: $618,000 - $707,000
3
Beds
2
Baths
1,800
Sq Ft
$364/Sq Ft
Est. Value
About This Home
This home is located at 555 West St, Wrentham, MA 02093 and is currently estimated at $654,376, approximately $363 per square foot. 555 West St is a home located in Norfolk County with nearby schools including Delaney Elementary School, Charles E Roderick, and Mercymount Country Day School.
Ownership History
Date
Name
Owned For
Owner Type
Purchase Details
Closed on
Jun 11, 2013
Sold by
Powers John P
Bought by
Garland Julie L and Garland-Powers Julie L
Current Estimated Value
Purchase Details
Closed on
Oct 27, 2010
Sold by
Mercier Margaret G
Bought by
Powers John P and Powers Julie L G
Home Financials for this Owner
Home Financials are based on the most recent Mortgage that was taken out on this home.
Original Mortgage
$327,588
Interest Rate
4.39%
Mortgage Type
Purchase Money Mortgage
Create a Home Valuation Report for This Property
The Home Valuation Report is an in-depth analysis detailing your home's value as well as a comparison with similar homes in the area
Home Values in the Area
Average Home Value in this Area
Purchase History
| Date | Buyer | Sale Price | Title Company |
|---|---|---|---|
| Garland Julie L | -- | -- | |
| Powers John P | $332,000 | -- |
Source: Public Records
Mortgage History
| Date | Status | Borrower | Loan Amount |
|---|---|---|---|
| Previous Owner | Powers John P | $327,588 |
Source: Public Records
Tax History Compared to Growth
Tax History
| Year | Tax Paid | Tax Assessment Tax Assessment Total Assessment is a certain percentage of the fair market value that is determined by local assessors to be the total taxable value of land and additions on the property. | Land | Improvement |
|---|---|---|---|---|
| 2025 | $6,490 | $560,000 | $288,200 | $271,800 |
| 2024 | $6,253 | $521,100 | $288,200 | $232,900 |
| 2023 | $6,150 | $487,300 | $262,100 | $225,200 |
| 2022 | $6,038 | $441,700 | $255,300 | $186,400 |
| 2021 | $5,849 | $415,700 | $238,600 | $177,100 |
| 2020 | $5,654 | $396,800 | $182,200 | $214,600 |
| 2019 | $5,193 | $367,800 | $164,000 | $203,800 |
| 2018 | $4,605 | $323,400 | $163,800 | $159,600 |
| 2017 | $4,326 | $303,600 | $160,700 | $142,900 |
| 2016 | $4,255 | $298,000 | $156,000 | $142,000 |
| 2015 | $4,361 | $291,100 | $166,600 | $124,500 |
| 2014 | $4,290 | $280,200 | $160,300 | $119,900 |
Source: Public Records
Map
Nearby Homes
- 50 Green St
- 80 Carriage House Ln
- 440 Chestnut St
- 1204 South St
- 1222 South St
- 19 Chestnut Lot 0
- 955 Summer St
- 11 Amber Dr
- 791 South St Unit 5
- 4 Munroe Dr
- 12 Grant St
- Lot 1 - Blueberry 2 Car Plan at King Philip Estates
- Lot 8 - Blueberry 2 Car Plan at King Philip Estates
- Lot 5 - Hughes 2 car Plan at King Philip Estates
- Lot 6 - Blueberry 3 Car Plan at King Philip Estates
- Lot 2 - Camden 2 Car Plan at King Philip Estates
- Lot 7 - Cedar Plan at King Philip Estates
- Lot 4 - Hemingway 2 Car Plan at King Philip Estates
- Lot 3 - Blueberry 2 Car Plan at King Philip Estates
- 387 South St