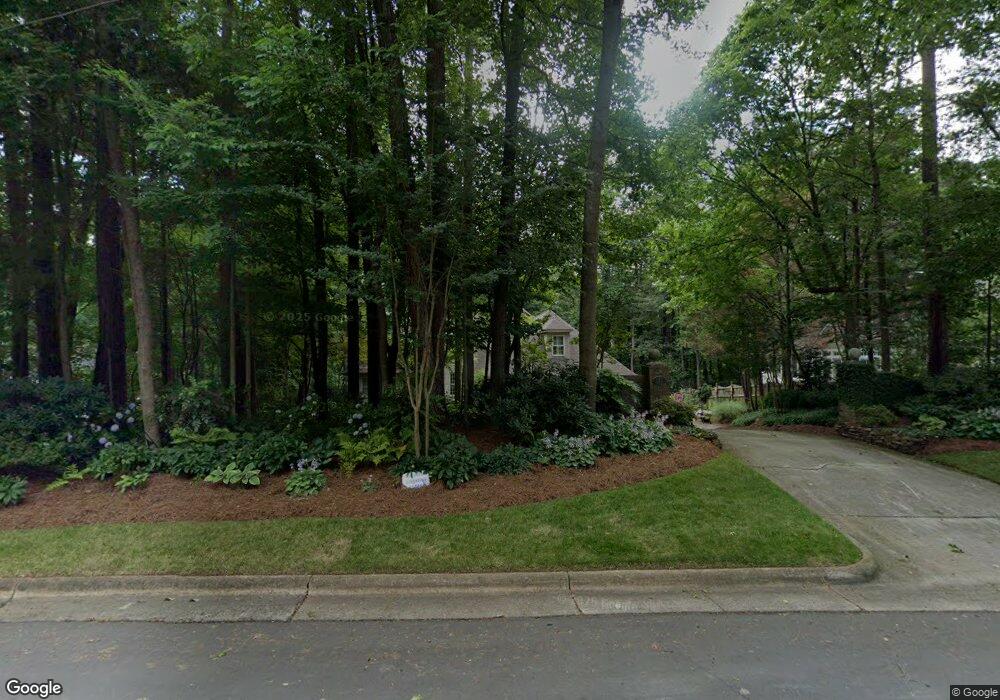
555 Windsor Place NE Concord, NC 28025
Estimated Value: $711,769 - $788,000
4
Beds
4
Baths
3,749
Sq Ft
$199/Sq Ft
Est. Value
About This Home
This home is located at 555 Windsor Place NE, Concord, NC 28025 and is currently estimated at $746,192, approximately $199 per square foot. 555 Windsor Place NE is a home located in Cabarrus County with nearby schools including Beverly Hills STEM Elementary, Concord Middle School, and Concord High School.
Ownership History
Date
Name
Owned For
Owner Type
Purchase Details
Closed on
Dec 17, 2013
Sold by
Mclester Elizabeth O
Bought by
Mclester Jerry M and Mclester Elizabeth O
Current Estimated Value
Purchase Details
Closed on
Nov 27, 2013
Sold by
Mclester Jonathan M and Mclester Andrew L
Bought by
Mclester Elizabeth O
Purchase Details
Closed on
Nov 29, 2010
Sold by
Mclester Jerry M and Mclester Elizabeth O
Bought by
Mclester Jonathan M and Mclester Andrew L
Purchase Details
Closed on
Nov 27, 2002
Sold by
Loukos Christopher A and Loukos Mary K
Bought by
Mclester Jerry M and Mclester Elizabeth O
Home Financials for this Owner
Home Financials are based on the most recent Mortgage that was taken out on this home.
Original Mortgage
$365,000
Outstanding Balance
$155,769
Interest Rate
6.15%
Mortgage Type
Credit Line Revolving
Estimated Equity
$590,423
Create a Home Valuation Report for This Property
The Home Valuation Report is an in-depth analysis detailing your home's value as well as a comparison with similar homes in the area
Home Values in the Area
Average Home Value in this Area
Purchase History
| Date | Buyer | Sale Price | Title Company |
|---|---|---|---|
| Mclester Jerry M | -- | None Available | |
| Mclester Elizabeth O | -- | None Available | |
| Mclester Jonathan M | -- | None Available | |
| Mclester Jerry M | -- | None Available | |
| Mclester Jerry M | $365,000 | -- |
Source: Public Records
Mortgage History
| Date | Status | Borrower | Loan Amount |
|---|---|---|---|
| Open | Mclester Jerry M | $365,000 |
Source: Public Records
Tax History Compared to Growth
Tax History
| Year | Tax Paid | Tax Assessment Tax Assessment Total Assessment is a certain percentage of the fair market value that is determined by local assessors to be the total taxable value of land and additions on the property. | Land | Improvement |
|---|---|---|---|---|
| 2025 | $7,028 | $705,660 | $63,800 | $641,860 |
| 2024 | $7,028 | $705,660 | $63,800 | $641,860 |
| 2023 | $5,297 | $434,160 | $50,600 | $383,560 |
| 2022 | $5,247 | $430,110 | $50,600 | $379,510 |
| 2021 | $5,247 | $430,110 | $50,600 | $379,510 |
| 2020 | $5,247 | $430,110 | $50,600 | $379,510 |
| 2019 | $5,056 | $414,400 | $49,500 | $364,900 |
| 2018 | $4,973 | $414,400 | $49,500 | $364,900 |
| 2017 | $4,890 | $414,400 | $49,500 | $364,900 |
| 2016 | $2,901 | $384,840 | $45,100 | $339,740 |
| 2015 | $4,541 | $384,840 | $45,100 | $339,740 |
| 2014 | $4,541 | $384,840 | $45,100 | $339,740 |
Source: Public Records
Map
Nearby Homes
- 635 Windsor Place NE
- 138 Tetbury Ave NE
- 457 Birchwood Trail NE
- 148 Palaside Dr NE
- 649 Camrose Cir NE
- 653 Camrose Cir NE
- 629 Camrose Cir NE Unit 45
- 606 Camrose Cir NE
- 80 Lecline Cir NE
- 1012 Burrage Rd NE
- 159 Madison Ave NE
- 147 Madison Ave NE
- 84 Lake Concord Rd NE Unit Q
- 336 Hamilton Dr NE
- 785 Rothmoor Dr NE
- 19 Todd Dr NE
- 410 Cameron Ave NE
- 140 Lake Concord Rd NE Unit D8
- 140 Lake Concord Rd NE Unit B7
- 396 Cameron Ave NE
- 545 Windsor Place NE
- 565 Windsor Place NE
- 535 Windsor Place NE
- 562 Windsor Place NE
- 570 Windsor Place NE
- 540 Windsor Place NE
- 529 Windsor Place NE
- 342 Huntingwood Place NE
- 524 Windsor Place NE
- 580 Windsor Place NE
- 608 Deveron Place NE
- 600 Deveron Place NE
- 336 Huntingwood Place NE
- 596 Deveron Place NE
- 637 Windsor Place NE
- 617 Deveron Place NE
- 613 Deveron Place NE
- 621 Deveron Place NE
- 248 Sidesmur Ct NE
- 609 Deveron Place NE