Estimated Value: $289,000 - $434,000
3
Beds
2
Baths
1,768
Sq Ft
$204/Sq Ft
Est. Value
About This Home
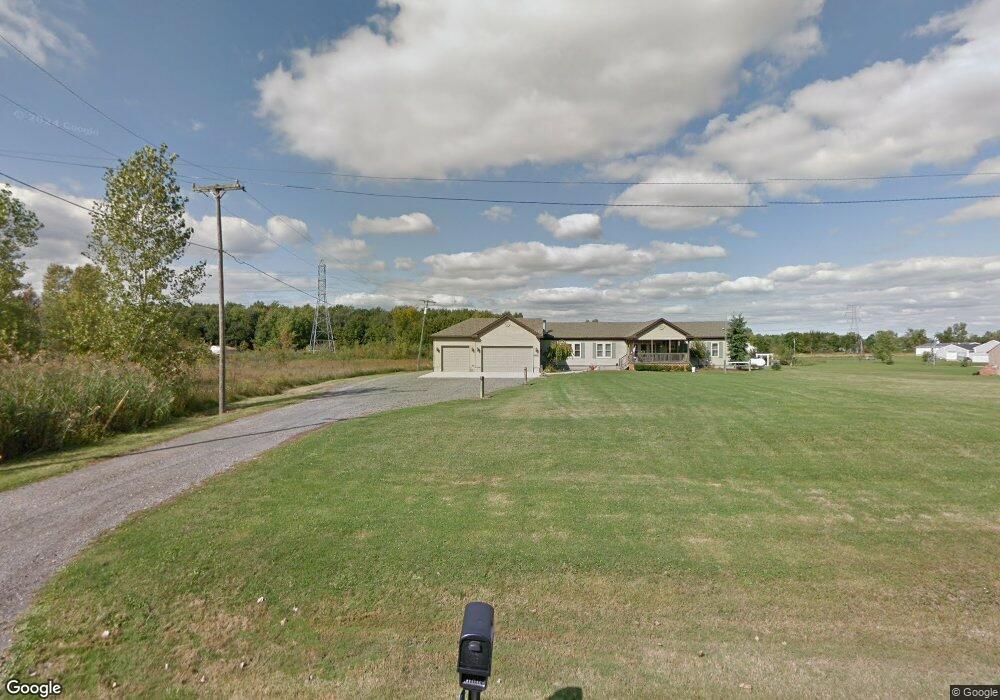
This home is located at 5550 Springborn Rd, China, MI 48054 and is currently estimated at $361,543, approximately $204 per square foot. 5550 Springborn Rd is a home located in St. Clair County with nearby schools including Belle River Elementary School, Marine City Middle School, and Marine City High School.
Ownership History
Date
Name
Owned For
Owner Type
Purchase Details
Closed on
Nov 7, 2006
Sold by
Dewulf Shirley R
Bought by
Dewulf Shirley R and Dewulf Kenneth A
Current Estimated Value
Home Financials for this Owner
Home Financials are based on the most recent Mortgage that was taken out on this home.
Original Mortgage
$167,170
Outstanding Balance
$99,714
Interest Rate
6.36%
Mortgage Type
FHA
Estimated Equity
$261,829
Purchase Details
Closed on
Feb 28, 2006
Sold by
Dewulf Shirley R
Bought by
Dewulf Kenneth A and Dewulf Colleen A
Purchase Details
Closed on
Apr 21, 2005
Sold by
Swartz Jerome M and Swartz Millrie
Bought by
Dewulf Shirley R
Home Financials for this Owner
Home Financials are based on the most recent Mortgage that was taken out on this home.
Original Mortgage
$222,500
Interest Rate
5.89%
Mortgage Type
New Conventional
Create a Home Valuation Report for This Property
The Home Valuation Report is an in-depth analysis detailing your home's value as well as a comparison with similar homes in the area
Home Values in the Area
Average Home Value in this Area
Purchase History
| Date | Buyer | Sale Price | Title Company |
|---|---|---|---|
| Dewulf Shirley R | -- | The Nova Title Agency Llc | |
| Dewulf Kenneth A | -- | None Available | |
| Dewulf Shirley R | $175,000 | Bayshore Title Agency |
Source: Public Records
Mortgage History
| Date | Status | Borrower | Loan Amount |
|---|---|---|---|
| Open | Dewulf Shirley R | $167,170 | |
| Closed | Dewulf Shirley R | $222,500 |
Source: Public Records
Tax History
| Year | Tax Paid | Tax Assessment Tax Assessment Total Assessment is a certain percentage of the fair market value that is determined by local assessors to be the total taxable value of land and additions on the property. | Land | Improvement |
|---|---|---|---|---|
| 2025 | $1,839 | $184,300 | $0 | $0 |
| 2024 | $1,784 | $192,200 | $0 | $0 |
| 2023 | $2,365 | $178,600 | $0 | $0 |
| 2022 | $2,365 | $154,400 | $0 | $0 |
| 2020 | $2,292 | $138,800 | $8,700 | $130,100 |
| 2019 | $2,116 | $134,100 | $0 | $0 |
| 2018 | $2,191 | $109,200 | $0 | $0 |
| 2017 | $2,153 | $108,400 | $0 | $0 |
| 2016 | $1,525 | $108,400 | $0 | $0 |
| 2015 | -- | $87,200 | $7,100 | $80,100 |
| 2014 | -- | $83,700 | $15,800 | $67,900 |
| 2013 | -- | $81,300 | $0 | $0 |
Source: Public Records
Map
Nearby Homes
- 0 King Rd Unit 50163813
- 0 Meisner Rd Unit 50142718
- 000 Marine City Hwy
- 3005 Plank Rd
- 171 N 6th St
- 0 Lindsey Rd Unit 20261004461
- 250 Huron Ln
- 00 Remer Rd
- 01 Remer Rd
- 486 N Belle River Ave
- 302 Hidden Harbors Way Unit 25
- 6124 River Rd
- 6200 River Rd
- 124 S 3rd St
- 138 S 3rd St
- 261 N Mary St
- 0 Chartier Rd
- vacant S Marine City Unit Vacant 26-mile road
- 0 Broadway St Unit 50176946
- V/L Mckinley Rd
- 5464 Marsh Rd
- 5428 Marsh Rd
- 5600 Springborn Rd
- 5482 Marsh Rd
- 5555 Springborn Rd
- 5555 Springborn Rd
- 5388 Marsh Rd
- 5510 Marsh Rd
- 5480 Springborn Rd
- 5484 Springborn Rd
- 05 Marsh Rd
- 04 Marsh Rd
- 02 Marsh Rd
- 03 Marsh Rd
- 01 Marsh Rd
- 5603 Springborn Rd
- 5378 Marsh Rd
- 5640 Springborn Rd
- 5346 Marsh Rd
- 5366 Marsh Rd
Your Personal Tour Guide
Ask me questions while you tour the home.