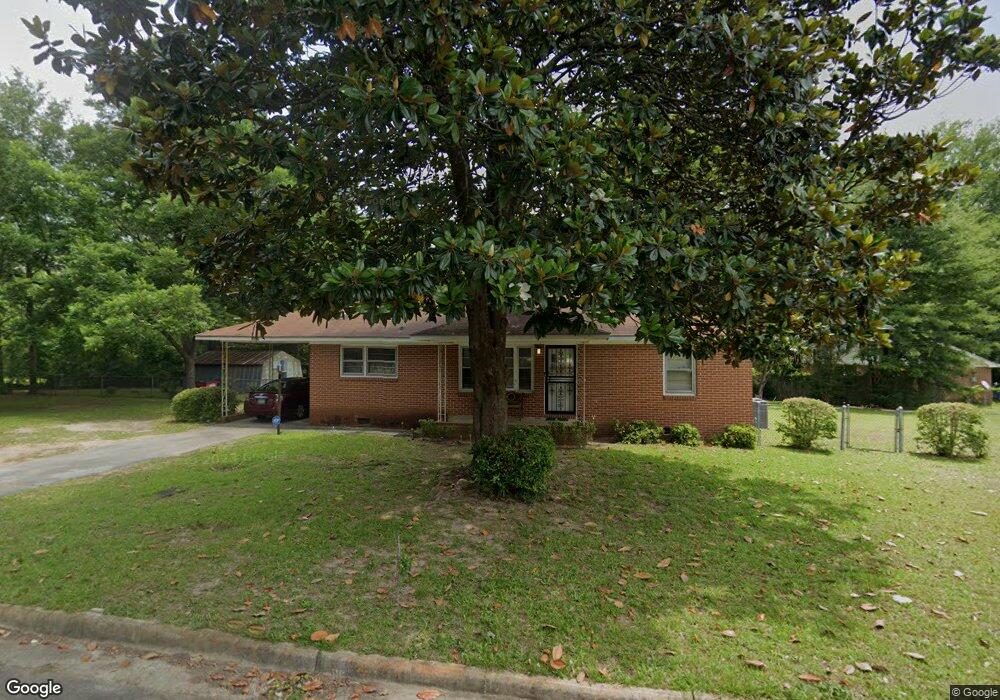
5550 Storey Dr Macon, GA 31206
Estimated Value: $103,000 - $134,027
3
Beds
2
Baths
1,422
Sq Ft
$81/Sq Ft
Est. Value
About This Home
This home is located at 5550 Storey Dr, Macon, GA 31206 and is currently estimated at $114,507, approximately $80 per square foot. 5550 Storey Dr is a home located in Bibb County with nearby schools including Veterans Elementary School, Southwest High School, and Gilead Christian Academy.
Ownership History
Date
Name
Owned For
Owner Type
Purchase Details
Closed on
Aug 3, 2007
Sold by
Smith A C
Bought by
Smith A C and Smith Evelyn
Current Estimated Value
Purchase Details
Closed on
Jul 20, 2007
Sold by
Smith Evelyn
Bought by
Smith A C
Purchase Details
Closed on
Jul 14, 2005
Sold by
Smith A C
Bought by
Smith A C and Smith Evelyn
Home Financials for this Owner
Home Financials are based on the most recent Mortgage that was taken out on this home.
Original Mortgage
$73,500
Interest Rate
8.3%
Mortgage Type
Adjustable Rate Mortgage/ARM
Purchase Details
Closed on
Jul 7, 2005
Sold by
Smith Earline B
Bought by
Smith A C
Home Financials for this Owner
Home Financials are based on the most recent Mortgage that was taken out on this home.
Original Mortgage
$73,500
Interest Rate
8.3%
Mortgage Type
Adjustable Rate Mortgage/ARM
Purchase Details
Closed on
Jan 26, 2005
Sold by
Spillers Cheryl Elaine
Bought by
Smith Earlene B
Purchase Details
Closed on
Nov 23, 1998
Create a Home Valuation Report for This Property
The Home Valuation Report is an in-depth analysis detailing your home's value as well as a comparison with similar homes in the area
Home Values in the Area
Average Home Value in this Area
Purchase History
| Date | Buyer | Sale Price | Title Company |
|---|---|---|---|
| Smith A C | -- | None Available | |
| Smith A C | -- | None Available | |
| Smith A C | -- | None Available | |
| Smith A C | $73,500 | None Available | |
| Smith Earlene B | -- | None Available | |
| -- | $55,000 | -- |
Source: Public Records
Mortgage History
| Date | Status | Borrower | Loan Amount |
|---|---|---|---|
| Previous Owner | Smith A C | $73,500 |
Source: Public Records
Tax History Compared to Growth
Tax History
| Year | Tax Paid | Tax Assessment Tax Assessment Total Assessment is a certain percentage of the fair market value that is determined by local assessors to be the total taxable value of land and additions on the property. | Land | Improvement |
|---|---|---|---|---|
| 2025 | $670 | $40,222 | $4,250 | $35,972 |
| 2024 | $697 | $40,222 | $4,250 | $35,972 |
| 2023 | $59 | $30,524 | $3,400 | $27,124 |
| 2022 | $500 | $26,273 | $4,484 | $21,789 |
| 2021 | $301 | $19,690 | $3,139 | $16,551 |
| 2020 | $147 | $14,238 | $2,242 | $11,996 |
| 2019 | $147 | $14,238 | $2,242 | $11,996 |
| 2018 | $393 | $13,890 | $2,242 | $11,648 |
| 2017 | $520 | $13,890 | $2,242 | $11,648 |
| 2016 | $481 | $13,890 | $2,242 | $11,648 |
| 2015 | $680 | $13,890 | $2,242 | $11,648 |
| 2014 | $759 | $13,470 | $2,242 | $11,228 |
Source: Public Records
Map
Nearby Homes
- 2755 Bonnie Ave
- 2675 Bonnie Ave
- 5530 Storey Dr
- 5530 Storey Dr Unit J1
- 0 Storey Dr Unit 7381879
- 2740 Virginia Dr
- 2763 Bonnie Ave
- 2684 Bonnie Ave
- 2764 Virginia Dr
- 2669 Bonnie Ave
- 2754 Bonnie Ave
- 2676 Bonnie Ave
- 2730 Virginia Dr
- 2770 Virginia Dr
- 2762 Bonnie Ave
- 2771 Bonnie Ave
- 2661 Bonnie Ave
- 2668 Bonnie Ave
- 2776 Virginia Dr
- 2681 Nancy Dr