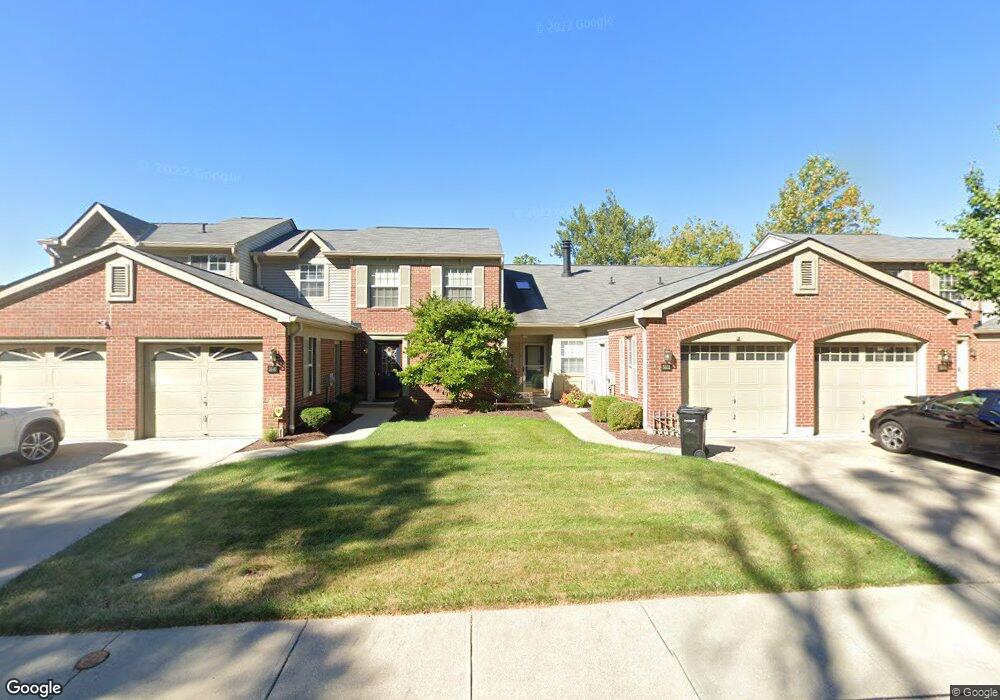
5551 Kiplington Dr Cincinnati, OH 45239
Mount Airy NeighborhoodEstimated Value: $194,000 - $232,747
2
Beds
2
Baths
1,153
Sq Ft
$180/Sq Ft
Est. Value
About This Home
This home is located at 5551 Kiplington Dr, Cincinnati, OH 45239 and is currently estimated at $207,437, approximately $179 per square foot. 5551 Kiplington Dr is a home with nearby schools including Mt. Airy Elementary School, Western Hills High School, and Gilbert A. Dater High School.
Ownership History
Date
Name
Owned For
Owner Type
Purchase Details
Closed on
Oct 15, 2003
Sold by
Teras Lee M and Teras Tara
Bought by
Lohr Deborah J
Current Estimated Value
Home Financials for this Owner
Home Financials are based on the most recent Mortgage that was taken out on this home.
Original Mortgage
$82,900
Interest Rate
6.49%
Mortgage Type
Unknown
Purchase Details
Closed on
Jun 23, 2000
Sold by
Tonnis Diann C
Bought by
Teras Lee M
Home Financials for this Owner
Home Financials are based on the most recent Mortgage that was taken out on this home.
Original Mortgage
$106,445
Interest Rate
8.64%
Mortgage Type
FHA
Purchase Details
Closed on
Aug 15, 1996
Sold by
Mundy Michael C
Bought by
Tonnis Diann C
Home Financials for this Owner
Home Financials are based on the most recent Mortgage that was taken out on this home.
Original Mortgage
$46,000
Interest Rate
8.27%
Create a Home Valuation Report for This Property
The Home Valuation Report is an in-depth analysis detailing your home's value as well as a comparison with similar homes in the area
Home Values in the Area
Average Home Value in this Area
Purchase History
| Date | Buyer | Sale Price | Title Company |
|---|---|---|---|
| Lohr Deborah J | $108,000 | -- | |
| Teras Lee M | $106,500 | Vintage Title Agency Inc | |
| Tonnis Diann C | $86,500 | -- |
Source: Public Records
Mortgage History
| Date | Status | Borrower | Loan Amount |
|---|---|---|---|
| Previous Owner | Lohr Deborah J | $82,900 | |
| Previous Owner | Teras Lee M | $106,445 | |
| Previous Owner | Tonnis Diann C | $46,000 |
Source: Public Records
Tax History Compared to Growth
Tax History
| Year | Tax Paid | Tax Assessment Tax Assessment Total Assessment is a certain percentage of the fair market value that is determined by local assessors to be the total taxable value of land and additions on the property. | Land | Improvement |
|---|---|---|---|---|
| 2024 | $3,005 | $50,442 | $11,200 | $39,242 |
| 2023 | $3,073 | $50,442 | $11,200 | $39,242 |
| 2022 | $2,181 | $32,116 | $5,600 | $26,516 |
| 2021 | $2,101 | $32,116 | $5,600 | $26,516 |
| 2020 | $2,163 | $32,116 | $5,600 | $26,516 |
| 2019 | $1,871 | $25,417 | $5,600 | $19,817 |
| 2018 | $1,874 | $25,417 | $5,600 | $19,817 |
| 2017 | $1,780 | $25,417 | $5,600 | $19,817 |
| 2016 | $1,720 | $24,220 | $5,600 | $18,620 |
| 2015 | $1,550 | $24,220 | $5,600 | $18,620 |
| 2014 | $1,562 | $24,220 | $5,600 | $18,620 |
| 2013 | $1,986 | $30,275 | $7,000 | $23,275 |
Source: Public Records
Map
Nearby Homes
- 2235 W North Bend Rd
- 5971 Monticello Ave
- 2310 van Leunen Dr
- 2142 W North Bend Rd
- 2146 W North Bend Rd
- 2413 Buddleia Ct
- 2477 Kipling Ave
- 5612 Colerain Ave
- 5459 Kirby Ave
- 2503 Flanigan Ct
- 2045 1st Ave
- 5671 Colerain Ave
- 2603 Kipling Ave
- 2342 Banning Rd
- 1963 W North Bend Rd
- 5851 Monfort Hills Ave
- 2125 Mckinley Ave
- 2536 Flanigan Ct
- 2538 Byrneside Dr
- 5937 Oakwood Ave
- 5547 Kiplington Dr
- 5553 Kiplington Dr
- 5545 Kiplington Dr
- 5557 Kiplington Dr
- 5561 Kiplington Dr
- 5541 Kiplington Dr
- 5565 Kiplington Dr
- 5537 Kiplington Dr
- 5569 Kiplington Dr
- 5535 Kiplington Dr
- 5571 Kiplington Dr
- 5531 Kiplington Dr
- 5575 Kiplington Dr
- 5581 Kiplington Dr
- 2229 Sweetbriar Ln
- 2241 Sweetbriar Ln Unit 20
- 2237 Sweetbriar Ln
- 5585 Kiplington Dr
- 2320 W North Bend Rd
- 5589 Kiplington Dr