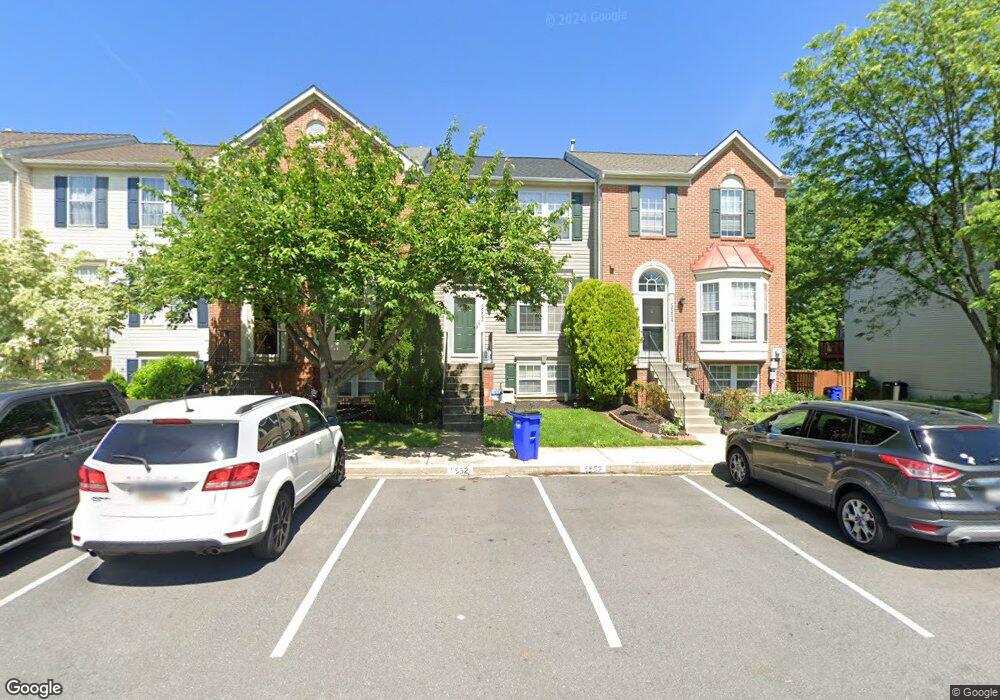
5552 Westcott Cir Frederick, MD 21703
Estimated Value: $410,000 - $433,000
4
Beds
4
Baths
1,680
Sq Ft
$250/Sq Ft
Est. Value
About This Home
This home is located at 5552 Westcott Cir, Frederick, MD 21703 and is currently estimated at $419,629, approximately $249 per square foot. 5552 Westcott Cir is a home located in Frederick County with nearby schools including Ballenger Creek Elementary, Ballenger Creek Middle School, and Tuscarora High School.
Ownership History
Date
Name
Owned For
Owner Type
Purchase Details
Closed on
Oct 10, 2008
Sold by
Bautista Lady Anne M
Bought by
Scott Ramont E
Current Estimated Value
Home Financials for this Owner
Home Financials are based on the most recent Mortgage that was taken out on this home.
Original Mortgage
$250,441
Outstanding Balance
$166,378
Interest Rate
6.41%
Mortgage Type
FHA
Estimated Equity
$253,251
Purchase Details
Closed on
Sep 30, 2008
Sold by
Bautista Lady Anne M
Bought by
Scott Ramont E
Home Financials for this Owner
Home Financials are based on the most recent Mortgage that was taken out on this home.
Original Mortgage
$250,441
Outstanding Balance
$166,378
Interest Rate
6.41%
Mortgage Type
FHA
Estimated Equity
$253,251
Purchase Details
Closed on
Dec 2, 2004
Sold by
Zaw Win Mark
Bought by
Bautista Lady Anne M and Za Wayne Thomas
Purchase Details
Closed on
Jun 19, 2001
Sold by
Zinn Sara
Bought by
Zaw Win Mark
Purchase Details
Closed on
Oct 28, 1999
Sold by
Nvr Inc
Bought by
Zinn Sara
Create a Home Valuation Report for This Property
The Home Valuation Report is an in-depth analysis detailing your home's value as well as a comparison with similar homes in the area
Home Values in the Area
Average Home Value in this Area
Purchase History
| Date | Buyer | Sale Price | Title Company |
|---|---|---|---|
| Scott Ramont E | $255,000 | -- | |
| Scott Ramont E | $255,000 | -- | |
| Bautista Lady Anne M | $269,000 | -- | |
| Zaw Win Mark | $170,000 | -- | |
| Zinn Sara | $157,924 | -- |
Source: Public Records
Mortgage History
| Date | Status | Borrower | Loan Amount |
|---|---|---|---|
| Open | Scott Ramont E | $250,441 | |
| Closed | Scott Ramont E | $250,441 | |
| Closed | Zinn Sara | -- |
Source: Public Records
Tax History
| Year | Tax Paid | Tax Assessment Tax Assessment Total Assessment is a certain percentage of the fair market value that is determined by local assessors to be the total taxable value of land and additions on the property. | Land | Improvement |
|---|---|---|---|---|
| 2025 | $3,631 | $332,700 | $85,000 | $247,700 |
| 2024 | $3,631 | $309,733 | $0 | $0 |
| 2023 | $3,316 | $286,767 | $0 | $0 |
| 2022 | $3,152 | $263,800 | $80,000 | $183,800 |
| 2021 | $3,006 | $257,533 | $0 | $0 |
| 2020 | $3,006 | $251,267 | $0 | $0 |
| 2019 | $2,933 | $245,000 | $63,400 | $181,600 |
| 2018 | $2,951 | $244,267 | $0 | $0 |
| 2017 | $2,916 | $245,000 | $0 | $0 |
| 2016 | $2,666 | $242,800 | $0 | $0 |
| 2015 | $2,666 | $235,600 | $0 | $0 |
| 2014 | $2,666 | $228,400 | $0 | $0 |
Source: Public Records
Map
Nearby Homes
- 6502 D Montalto Crossing
- 6506 C Wiltshire Dr Unit 205
- 6506 D Wiltshire Dr Unit 102
- 6613 Haydown Ct
- 6409 Weatherby Ct Unit M
- 6909 Doublebrand Ct
- 6405 Weatherby Ct Unit J
- 5392 Siri Ct
- 5388 Siri Ct
- 5384 Siri Ct
- 5640 Crabapple Dr
- 5246 Red Maple Dr
- 5693 Crabapple Dr
- 6905 Chokeberry Ct
- 6597 Ewald Ct
- 6214 Hastings Ct
- 7058 Catalpa Rd
- 6844 Carnation Cir
- 6846 Carnation Cir
- 5823 Box Elder Ct
- 5550 Westcott Cir
- 5554 Westcott Cir
- 5548 Westcott Cir
- 5546 Westcott Cir
- 5544 Westcott Cir
- 5542 Westcott Cir
- 5531 Westcott Cir
- 5529 Westcott Cir
- 5540 Westcott Cir
- 5527 Westcott Cir
- 5525 Westcott Cir
- 5534 Westcott Cir
- 5536 Westcott Cir
- 5532 Westcott Cir
- 5538 Westcott Cir
- 5530 Westcott Cir
- 5528 Westcott Cir
- 5523 Westcott Cir
- 5526 Westcott Cir
- 5524 Westcott Cir
Your Personal Tour Guide
Ask me questions while you tour the home.