
Seller's Agent in 2020
Jesse England
RE/MAX Michigan
(810) 686-8667
73 Total Sales
Estimated Value: $198,173 - $232,000
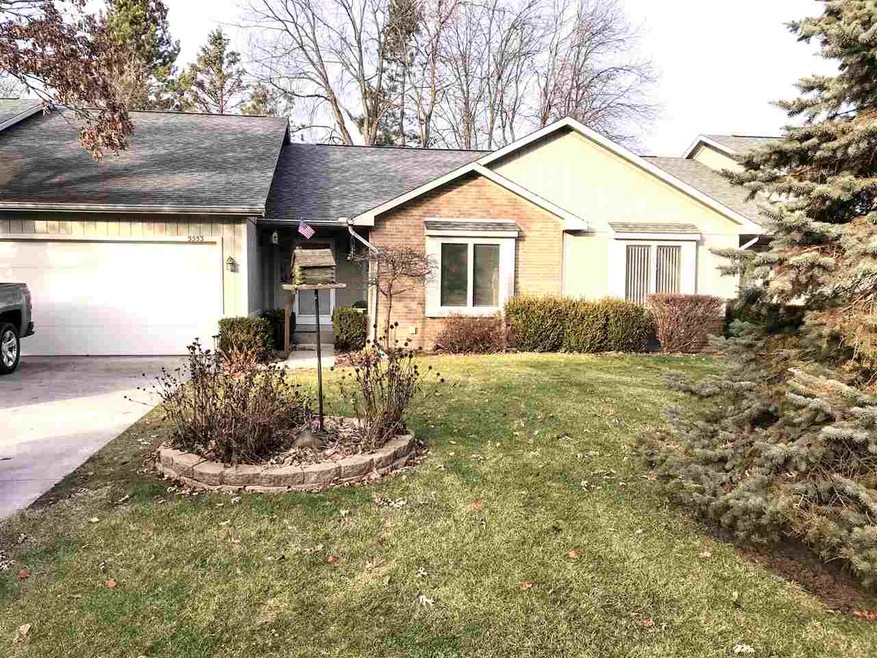
Spacious Flushing Townhouse, with a large Firelit Great Room with cathedral Ceilings & Skylights. This home features a Master Bedroom Suite with master bath. Plus a fully applianced kitchen with snack bar and built in desk and a spacious dining room. Also featuring a first floor Laundry, plus a three season Florida room overlooking a beautiful wooded courtyard, with a privacy fenced patio area. This home features Anderson windows, Six panel doors, and Beveled Glass Entry Door, and ceramic tile in the bathroomss. This home also has a Spacious Finished Basement with Large Family room, Recreation room and two additional bedrooms or Offices. plus a two car attached garage.
Last Agent to Sell the Property
REMAX Right Choice License #FAAR-122296 Listed on: 12/16/2019
Co-Listed By
Cassandra Cox
REMAX Right Choice License #FAAR-124646
We collect this data history from publicly available records. To have your information removed, we recommend requesting removal directly through your county’s website.
We collect this data history from publicly available records. To have your information removed, we recommend requesting removal directly through your county’s website.
| Date | Buyer | Sale Price | Title Company |
|---|---|---|---|
| -- | None Listed On Document | ||
| -- | None Listed On Document | ||
| $138,000 | First American Title Ins Co | ||
| -- | Fnc Title Services Llc | ||
| -- | None Available | ||
| $70,000 | Sargents Title Company | ||
| $135,000 | First American Title |
We collect this data history from publicly available records. To have your information removed, we recommend requesting removal directly through your county’s website.
| Date | Status | Borrower | Loan Amount |
|---|---|---|---|
| Previous Owner | $131,100 | ||
| Previous Owner | $179,250 |
We collect this data history from publicly available records. To have your information removed, we recommend requesting removal directly through your county’s website.
| Date | Event | Price | List to Sale | Price per Sq Ft | Prior Sale |
|---|---|---|---|---|---|
| 03/06/2020 03/06/20 | Sold | $138,000 | -1.4% | $88 / Sq Ft | |
| 02/10/2020 02/10/20 | Pending | -- | -- | -- | |
| 12/16/2019 12/16/19 | For Sale | $139,900 | +99.9% | $89 / Sq Ft | |
| 11/08/2012 11/08/12 | Sold | $70,000 | +16.7% | $45 / Sq Ft | View Prior Sale |
| 07/20/2012 07/20/12 | Pending | -- | -- | -- | |
| 05/23/2012 05/23/12 | For Sale | $60,000 | -- | $38 / Sq Ft |
We collect this data history from publicly available records. To have your information removed, we recommend requesting removal directly through your county’s website.
| Year | Tax Paid | Tax Assessment Tax Assessment Total Assessment is a certain percentage of the fair market value that is determined by local assessors to be the total taxable value of land and additions on the property. | Land | Improvement |
|---|---|---|---|---|
| 2025 | $941 | $100,800 | $0 | $0 |
| 2024 | $916 | $95,700 | $0 | $0 |
| 2023 | $873 | $82,900 | $0 | $0 |
| 2022 | $3,243 | $72,300 | $0 | $0 |
| 2021 | $3,241 | $71,900 | $0 | $0 |
| 2020 | $583 | $62,700 | $0 | $0 |
| 2019 | $574 | $56,900 | $0 | $0 |
| 2018 | $2,181 | $58,000 | $0 | $0 |
| 2017 | $2,089 | $57,800 | $0 | $0 |
| 2016 | $2,071 | $52,500 | $0 | $0 |
| 2015 | $1,925 | $49,900 | $0 | $0 |
| 2014 | $529 | $46,000 | $0 | $0 |
| 2012 | -- | $55,900 | $55,900 | $0 |
Seller's Agent in 2020
Jesse England
RE/MAX Michigan
(810) 686-8667
73 Total Sales
C
Seller Co-Listing Agent in 2020
Cassandra Cox
RE/MAX Michigan
Buyer's Agent in 2020
Bob Smith
BOMIC Real Estate
(989) 823-1111
196 Total Sales
Seller's Agent in 2012
Dale Wolbert
Wolbert Realty, LLC
(810) 577-7446
97 Total Sales
M
Buyer's Agent in 2012
Mirs Staff
MI_MiRealSource
Source: Michigan Multiple Listing Service
MLS Number: 50002125
APN: 14-32-502-049
Disclaimer: Certain information contained herein is derived from information provided by parties other than Homes.com. All information provided is deemed reliable, but is not guaranteed to be accurate and should be independently verified.
![]() Source MLS: MiRealSource
Source MLS: MiRealSource
Provided through IDX via MiRealSource. Courtesy of MiRealSource Shareholder. Copyright MiRealSource.
The information published and disseminated by MiRealSource is communicated verbatim, without change by MiRealSource, as filed with MiRealSource by its members. The accuracy of all information, regardless of source, is not guaranteed or warranted. All information should be independently verified.
Copyright 2026 MiRealSource. All rights reserved. The information provided hereby constitutes proprietary information of MiRealSource, Inc. and its shareholders, affiliates and licensees and may not be reproduced or transmitted in any form or by any means, electronic or mechanical, including photocopy, recording, scanning or any information storage and retrieval system, without written permission from MiRealSource, Inc.
Ask me questions while you tour the home.