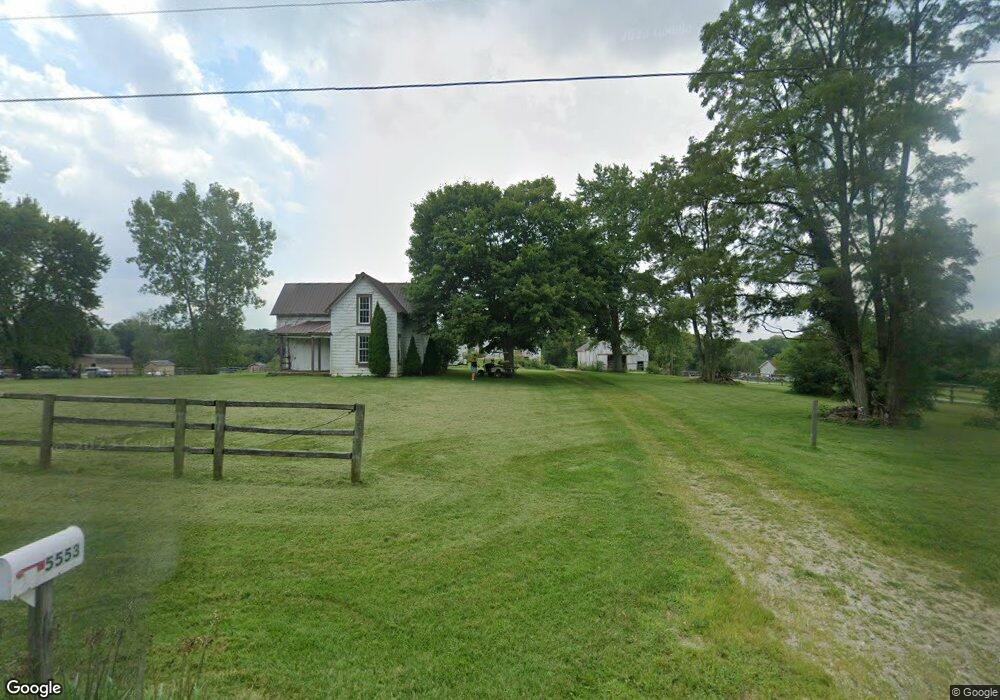
5553 New Burlington Rd Wilmington, OH 45177
Estimated Value: $167,607 - $308,000
3
Beds
1
Bath
1,410
Sq Ft
$161/Sq Ft
Est. Value
About This Home
This home is located at 5553 New Burlington Rd, Wilmington, OH 45177 and is currently estimated at $226,902, approximately $160 per square foot. 5553 New Burlington Rd is a home located in Clinton County with nearby schools including Xenia High School.
Ownership History
Date
Name
Owned For
Owner Type
Purchase Details
Closed on
Jul 15, 2022
Sold by
Rsf Properties Llc
Bought by
Glaser Lenny J and Glaser Jessica R
Current Estimated Value
Purchase Details
Closed on
Jun 21, 2019
Sold by
Garringer Kevan and Garringer Julie
Bought by
Rsf Properties Llc
Purchase Details
Closed on
Feb 8, 2019
Sold by
Downard Sharon N
Bought by
Garringer Kevan and Garringer Julie
Purchase Details
Closed on
Sep 1, 2006
Sold by
Lamb Susan A
Bought by
Downard Sharon N
Purchase Details
Closed on
Feb 18, 2004
Sold by
Downard Sharon N
Bought by
Lamb Susan A
Home Financials for this Owner
Home Financials are based on the most recent Mortgage that was taken out on this home.
Original Mortgage
$259,900
Interest Rate
5.96%
Mortgage Type
Purchase Money Mortgage
Purchase Details
Closed on
Feb 11, 2004
Sold by
Downard Sharon and Downard Sharon N
Bought by
Lamb Susan A
Home Financials for this Owner
Home Financials are based on the most recent Mortgage that was taken out on this home.
Original Mortgage
$259,900
Interest Rate
5.96%
Mortgage Type
Purchase Money Mortgage
Purchase Details
Closed on
Nov 16, 2001
Sold by
Jewett Bobby D
Bought by
Downard Sharon N
Create a Home Valuation Report for This Property
The Home Valuation Report is an in-depth analysis detailing your home's value as well as a comparison with similar homes in the area
Home Values in the Area
Average Home Value in this Area
Purchase History
| Date | Buyer | Sale Price | Title Company |
|---|---|---|---|
| Glaser Lenny J | -- | None Listed On Document | |
| Rsf Properties Llc | $135,000 | None Available | |
| Garringer Kevan | $50,000 | None Available | |
| Downard Sharon N | $156,916 | -- | |
| Lamb Susan A | $259,900 | -- | |
| Lamb Susan A | $259,900 | -- | |
| Downard Sharon N | $150,000 | -- |
Source: Public Records
Mortgage History
| Date | Status | Borrower | Loan Amount |
|---|---|---|---|
| Previous Owner | Lamb Susan A | $259,900 |
Source: Public Records
Tax History Compared to Growth
Tax History
| Year | Tax Paid | Tax Assessment Tax Assessment Total Assessment is a certain percentage of the fair market value that is determined by local assessors to be the total taxable value of land and additions on the property. | Land | Improvement |
|---|---|---|---|---|
| 2024 | $2,124 | $57,020 | $29,330 | $27,690 |
| 2023 | $2,023 | $57,020 | $29,330 | $27,690 |
| 2022 | $1,829 | $47,490 | $20,160 | $27,330 |
| 2021 | $1,831 | $47,490 | $20,160 | $27,330 |
| 2020 | $1,664 | $47,490 | $20,160 | $27,330 |
| 2019 | $1,645 | $43,450 | $20,160 | $23,290 |
| 2018 | $1,746 | $43,450 | $20,160 | $23,290 |
| 2017 | $1,618 | $43,450 | $20,160 | $23,290 |
| 2016 | $1,801 | $48,340 | $21,490 | $26,850 |
| 2015 | $1,741 | $48,340 | $21,490 | $26,850 |
| 2013 | $2,777 | $46,550 | $21,490 | $25,060 |
Source: Public Records
Map
Nearby Homes
- 8760 State Route 380
- 668 New Burlington Rd
- 0A Old Winchester Trail
- 0C Old Winchester Trail
- 0B Old Winchester Trail
- 8648 Compton Rd
- 3620 Old Winchester Trail
- 9052 Wilson Rd
- 6329 State Route 380
- 9500 Collett Rd Unit 20
- 2783 Us Route 68 S
- 196 Mound St
- 2400 U S 68
- 8881 Route 42
- 2268 E Spring Valley Paintersville Rd
- 3863 S Old Us Rt 68
- 1736 Winchester Rd
- 10031 Ohio 73
- 291 Main St
- 2 Acres Mount Holly Rd
- 5577 New Burlington Rd
- 5523 New Burlington Rd
- 5463 New Burlington Rd
- 5580 New Burlington Rd
- 5635 New Burlington Rd
- 5691 New Burlington Rd
- 5640 New Burlington Rd
- 5488 New Burlington Rd
- 5596 New Burlington Rd
- 5385 New Burlington Rd
- 5526 New Burlington Rd
- 5703 New Burlington Rd
- 5426 New Burlington Rd
- 5649 New Burlington Rd
- 5680 New Burlington Rd
- 84 Hormell Rd
- 5718 New Burlington Rd
- 5408 New Burlington Rd
- 50 Hormell Rd
- 5317 New Burlington Rd