Estimated Value: $427,000 - $475,000
3
Beds
2
Baths
1,672
Sq Ft
$272/Sq Ft
Est. Value
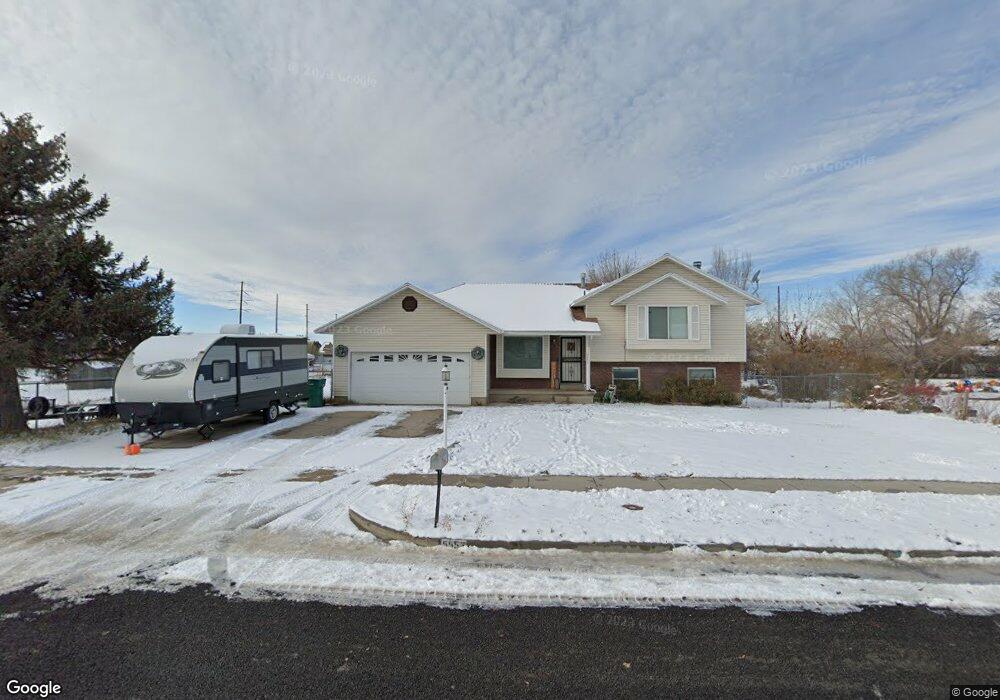
About This Home
This home is located at 5553 S 3450 W, Roy, UT 84067 and is currently estimated at $455,254, approximately $272 per square foot. 5553 S 3450 W is a home located in Weber County with nearby schools including Roy Elementary School, Roy Junior High School, and Roy High School.
Ownership History
Date
Name
Owned For
Owner Type
Purchase Details
Closed on
Aug 30, 2017
Sold by
Carucci Ronald Anthony
Bought by
Michaelis Andrew Steven
Current Estimated Value
Home Financials for this Owner
Home Financials are based on the most recent Mortgage that was taken out on this home.
Original Mortgage
$247,350
Outstanding Balance
$206,887
Interest Rate
3.96%
Mortgage Type
New Conventional
Estimated Equity
$248,367
Create a Home Valuation Report for This Property
The Home Valuation Report is an in-depth analysis detailing your home's value as well as a comparison with similar homes in the area
Home Values in the Area
Average Home Value in this Area
Purchase History
| Date | Buyer | Sale Price | Title Company |
|---|---|---|---|
| Michaelis Andrew Steven | -- | Mountain View Title |
Source: Public Records
Mortgage History
| Date | Status | Borrower | Loan Amount |
|---|---|---|---|
| Open | Michaelis Andrew Steven | $247,350 |
Source: Public Records
Tax History Compared to Growth
Tax History
| Year | Tax Paid | Tax Assessment Tax Assessment Total Assessment is a certain percentage of the fair market value that is determined by local assessors to be the total taxable value of land and additions on the property. | Land | Improvement |
|---|---|---|---|---|
| 2025 | $2,851 | $434,174 | $140,005 | $294,169 |
| 2024 | $2,793 | $234,847 | $77,002 | $157,845 |
| 2023 | $2,613 | $218,900 | $76,832 | $142,068 |
| 2022 | $2,645 | $227,150 | $63,251 | $163,899 |
| 2021 | $2,304 | $325,000 | $85,014 | $239,986 |
| 2020 | $2,163 | $280,001 | $85,014 | $194,987 |
| 2019 | $2,066 | $252,000 | $55,086 | $196,914 |
| 2018 | $1,918 | $232,001 | $50,061 | $181,940 |
| 2017 | $1,649 | $190,000 | $50,061 | $139,939 |
| 2016 | $1,478 | $90,810 | $24,743 | $66,067 |
| 2015 | $1,430 | $86,953 | $24,743 | $62,210 |
| 2014 | $1,451 | $86,954 | $24,743 | $62,211 |
Source: Public Records
Map
Nearby Homes