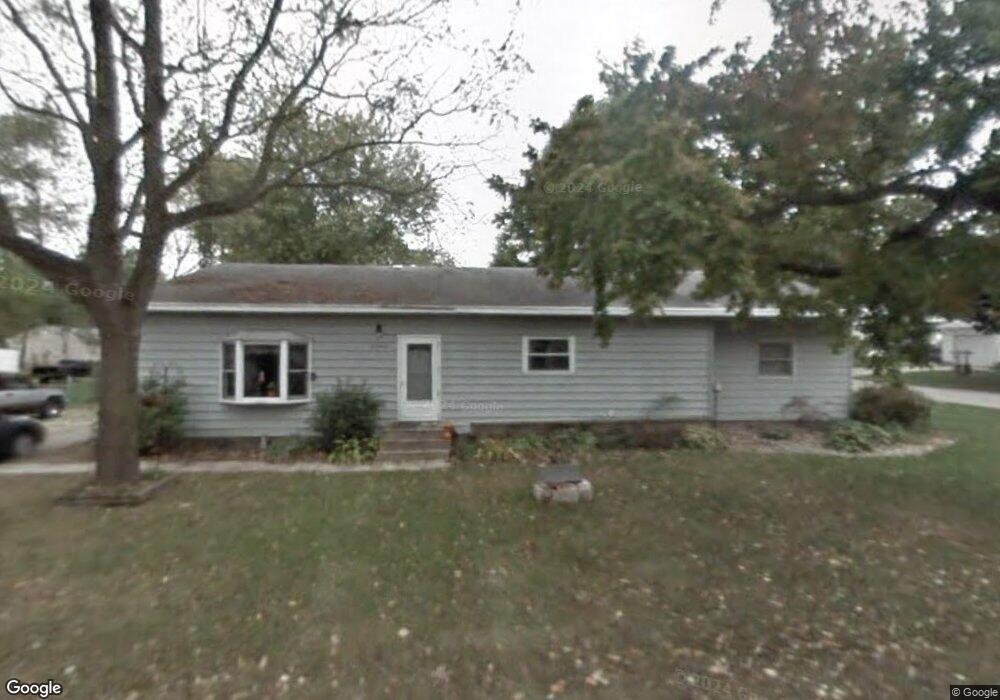
5553 S Main St Winamac, IN 46996
Estimated Value: $122,000 - $189,000
4
Beds
2
Baths
2,072
Sq Ft
$75/Sq Ft
Est. Value
About This Home
This home is located at 5553 S Main St, Winamac, IN 46996 and is currently estimated at $156,127, approximately $75 per square foot. 5553 S Main St is a home located in Pulaski County with nearby schools including Eastern Pulaski Elementary School, Winamac Community Middle School, and Winamac Community High School.
Ownership History
Date
Name
Owned For
Owner Type
Purchase Details
Closed on
Nov 28, 2011
Sold by
Schmicker Robert C
Bought by
Blackman Mason T
Current Estimated Value
Home Financials for this Owner
Home Financials are based on the most recent Mortgage that was taken out on this home.
Original Mortgage
$69,600
Outstanding Balance
$47,771
Interest Rate
4.08%
Mortgage Type
Future Advance Clause Open End Mortgage
Estimated Equity
$108,356
Purchase Details
Closed on
Feb 22, 2011
Sold by
Fannie Mae
Bought by
Schmicker Robert C
Purchase Details
Closed on
Nov 30, 2010
Sold by
1St Source Bank
Bought by
Federal National Mtg Assoc
Purchase Details
Closed on
Nov 17, 2010
Sold by
Garblson Jeffrey M
Bought by
Trustecorp Mortgage Corp
Create a Home Valuation Report for This Property
The Home Valuation Report is an in-depth analysis detailing your home's value as well as a comparison with similar homes in the area
Home Values in the Area
Average Home Value in this Area
Purchase History
| Date | Buyer | Sale Price | Title Company |
|---|---|---|---|
| Blackman Mason T | -- | None Available | |
| Schmicker Robert C | -- | None Available | |
| Federal National Mtg Assoc | $36,000 | -- | |
| Trustecorp Mortgage Corp | -- | None Available |
Source: Public Records
Mortgage History
| Date | Status | Borrower | Loan Amount |
|---|---|---|---|
| Open | Blackman Mason T | $69,600 |
Source: Public Records
Tax History Compared to Growth
Tax History
| Year | Tax Paid | Tax Assessment Tax Assessment Total Assessment is a certain percentage of the fair market value that is determined by local assessors to be the total taxable value of land and additions on the property. | Land | Improvement |
|---|---|---|---|---|
| 2024 | $959 | $84,800 | $5,700 | $79,100 |
| 2023 | $939 | $81,500 | $5,500 | $76,000 |
| 2022 | $948 | $75,900 | $5,000 | $70,900 |
| 2021 | $942 | $72,400 | $4,900 | $67,500 |
| 2020 | $883 | $71,300 | $4,700 | $66,600 |
| 2019 | $127 | $72,500 | $4,700 | $67,800 |
| 2018 | $120 | $63,200 | $4,500 | $58,700 |
| 2017 | $90 | $58,300 | $4,500 | $53,800 |
| 2016 | $89 | $56,700 | $4,100 | $52,600 |
| 2014 | $45 | $53,000 | $4,100 | $48,900 |
| 2013 | $45 | $52,400 | $4,100 | $48,300 |
Source: Public Records
Map
Nearby Homes
- 5556 Indiana 119
- 4330 S Rivercrest
- 43 E 600 S
- 8159 S Corinne Ave
- 8030 S 475 W
- 279 E 750 S
- 2918 S 50 E
- 2952 S Crestview Dr
- 2918 S County Rd 50 E
- 1584 S State Road 119
- 2598 E Eldridge St
- 1727 W West Win Rd S
- 449 W Washington St
- 421 S Franklin St
- 622 S Market St
- 415 S Franklin St
- 400 S Market St
- 103 E Washington St
- 650 U S 35
- 845 E 75n Rd