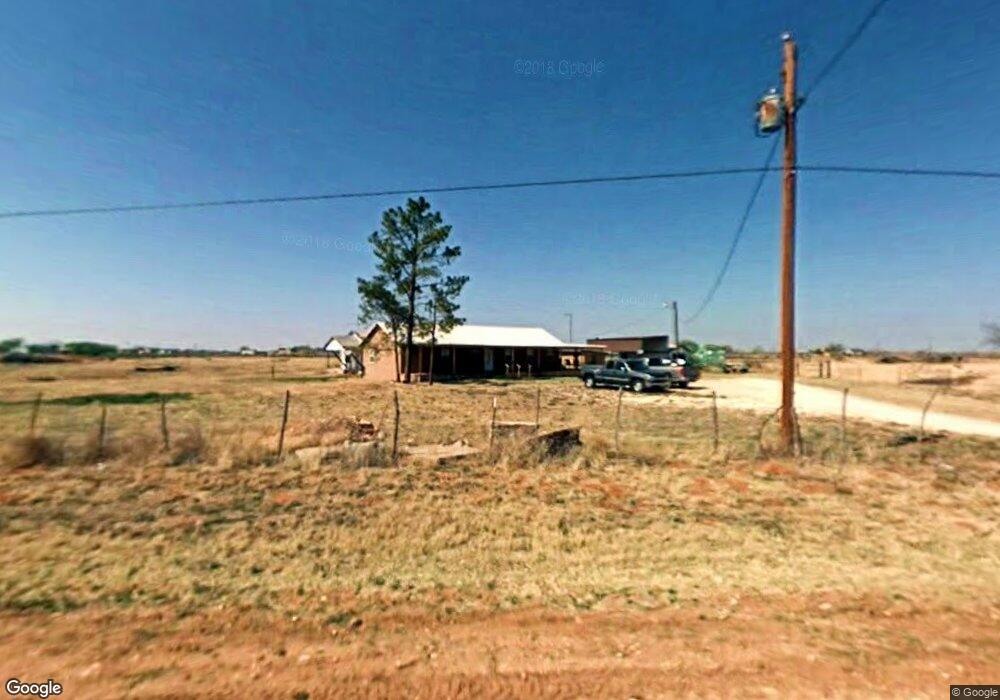
5555 SE 3000 Andrews, TX 79714
Estimated Value: $232,000 - $610,000
--
Bed
--
Bath
2,046
Sq Ft
$189/Sq Ft
Est. Value
About This Home
This home is located at 5555 SE 3000, Andrews, TX 79714 and is currently estimated at $385,727, approximately $188 per square foot. 5555 SE 3000 is a home located in Andrews County with nearby schools including Clearfork Elementary School, Underwood Elementary School, and Devonian Elementary School.
Ownership History
Date
Name
Owned For
Owner Type
Purchase Details
Closed on
May 15, 2007
Bought by
Finley Raymond Glen and Finley Ann Ginni
Current Estimated Value
Create a Home Valuation Report for This Property
The Home Valuation Report is an in-depth analysis detailing your home's value as well as a comparison with similar homes in the area
Home Values in the Area
Average Home Value in this Area
Purchase History
| Date | Buyer | Sale Price | Title Company |
|---|---|---|---|
| Finley Raymond Glen | -- | -- |
Source: Public Records
Tax History Compared to Growth
Tax History
| Year | Tax Paid | Tax Assessment Tax Assessment Total Assessment is a certain percentage of the fair market value that is determined by local assessors to be the total taxable value of land and additions on the property. | Land | Improvement |
|---|---|---|---|---|
| 2025 | $4,070 | $282,027 | $24,252 | $257,775 |
| 2024 | $3,600 | $249,468 | $24,252 | $225,216 |
| 2023 | $3,595 | $242,161 | $24,252 | $217,909 |
| 2022 | $4,051 | $226,619 | $24,252 | $202,367 |
| 2021 | $4,904 | $228,475 | $24,252 | $204,223 |
| 2020 | $4,580 | $219,595 | $24,252 | $195,343 |
| 2019 | $4,606 | $211,657 | $24,252 | $187,405 |
| 2018 | $4,576 | $206,591 | $24,252 | $182,339 |
| 2017 | $4,767 | $206,591 | $24,252 | $182,339 |
| 2016 | $2,641 | $127,785 | $24,252 | $103,533 |
| 2015 | -- | $107,595 | $24,252 | $83,343 |
| 2014 | -- | $112,250 | $18,870 | $93,380 |
Source: Public Records
Map
Nearby Homes
- 4975 SE 3000
- 2770 SE 4651
- 1800 SE 5001
- 3154 SE 4041
- 3115 SE 4001
- 3350 #26 SE 4001
- 3350 #6 SE 4001
- 3350 #7 SE 4001
- 3350 #9 SE 4001
- 3350 #12 SE 4001
- 3350 #14 SE 4001
- 3350 #24 SE 4001
- 3350 #18 SE 4001
- 3350 #28 SE 4001
- 3350 #23 SE 4001
- 3350 #17 SE 4001
- 3350 #35 SE 4001
- 3350 #34 SE 4001
- 3350 #4 SE 4001
- 3350 #5 SE 4001