NOT LISTED FOR SALE

5555 Smiths Creek Rd Kimball, MI 48074

Estimated Value: $304,000 - $425,000

5 Beds
2 Baths
1,500 Sq Ft
$245/Sq Ft Est. Value

Last Sold April 05, 2012

Last sale price $155,000 $103 Per Sq Ft

Est. 137% increase in value since last sale

Current estimated payment $2,210/month

About This Home

As of April 2012

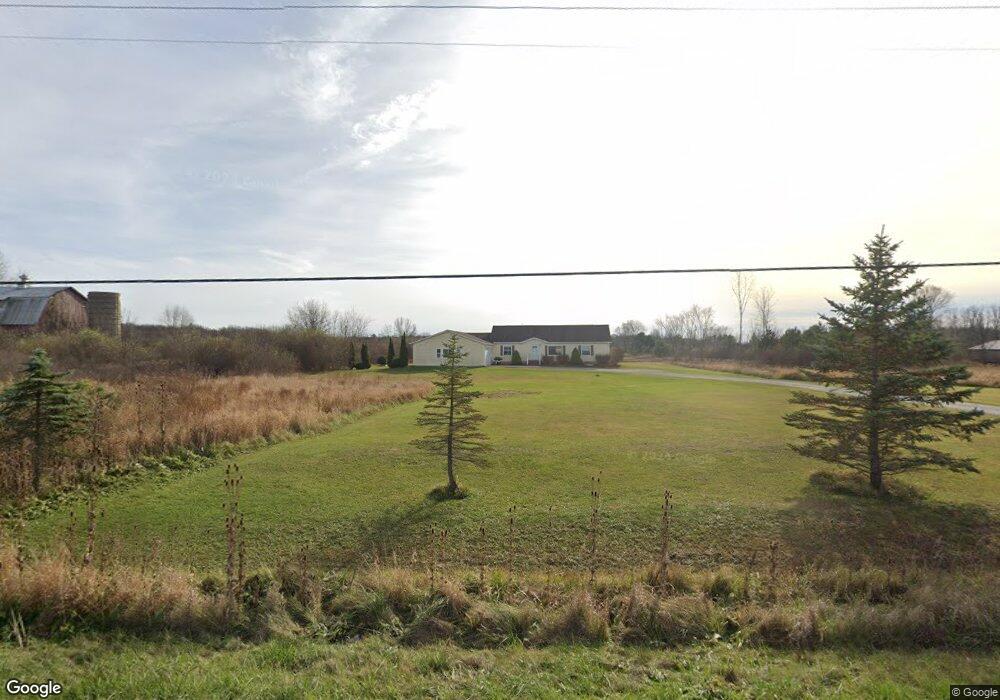
Great 5 bedroom 2 full bath home in Kimball Twp, Marysville Schools. This home is situated on 5 acres and has many amninities including: 50x30 attached garage, full finished basement w/2nd kitchen, 4ft wide staircase for moving large items to the basement, 1st flr laundry, hardwood floors and the list goes on. Hurry up, this one won't last!

Ownership History

Date Name Owned For Owner Type

Purchase Details

Listed on
Nov 14, 2011
Closed on
Apr 5, 2012
Sold by
Simovski Goran and Simovski Gordana
Bought by
Thoel Ryan
Seller's Agent
Michael Deising
Deising Real Estate Services, PC
Buyer's Agent
Bill Schneider
RE/MAX First
List Price
$154,900
Sold Price
$155,000
Premium/Discount to List
$100
0.06%
Current Estimated Value
$367,295

Home Financials for this Owner

Home Financials are based on the most recent Mortgage that was taken out on this home.
Estimated Appreciation
$212,295
Avg. Annual Appreciation
6.58%
Original Mortgage
$151,070
Outstanding Balance
$104,149
Interest Rate
3.87%
Mortgage Type
FHA
Estimated Equity
$263,146
Source: Public Records

Range of Values:

Collateral Analytics

Collateral Analytics Collateral Analytics AVMs (Automated Valuation Model) employ a number of statistical approaches combined with neighborhood-specific comparable selection guarantees the most up-to-date and precise valuations.

Not Available

Collateral Analytics does not have data for the current month. Please view the chart for historical values.

ICE

ICE Mortgage Technology ICE Mortgage Technology’s AVM (Automated Valuation Model) is a state-of-the-art online residential property valuation tool that provides a quick and accurate estimate of the value of almost any home in the U.S.

Not Available

ICE Mortgage Technology does not have data for the current month. Please view the chart for historical values.

First American

First American First American Data & Analytics’ next-generation AVM combines unrivaled data assets with a blended ensemble of valuation models to produce highly accurate, reliable valuations you can trust.

Not Available

First American does not have data for the current month. Please view the chart for historical values.

Quantarium

Quantarium Quantarium’s valuation service, repeatedly proven the industry’s most accurate and comprehensive, is supercharged with a self-learning and auto-tuning AI engine that continually becomes smarter and more accurate as it processes daily inputs from the industry’s leading RE data lake.

Not Available

Quantarium does not have data for the current month. Please view the chart for historical values.

Average Value
Not Available
List Price
Sold Price
Create a Home Valuation Report for This Property
The Home Valuation Report is an in-depth analysis detailing your home's value as well as a comparison with similar homes in the area

Home Values in the Area

Source: Public Records

Average Home Value in this Area


Source: Public Records

Purchase History

Date Buyer Sale Price Title Company
Thoel Ryan $155,000 Sterling Title Agency
Source: Public Records

Mortgage History

Date Status Borrower Loan Amount
Open Thoel Ryan $151,070
Source: Public Records

Property History

Date Event Price List to Sale Price per Sq Ft Prior Sale
04/05/2012 04/05/12 Sold $155,000 +0.1% $103 / Sq Ft View Prior Sale
03/23/2012 03/23/12 Pending -- -- --
11/14/2011 11/14/11 For Sale $154,900 -- $103 / Sq Ft

Tax History Compared to Growth

Source: Public Records

Tax History

Year Tax Paid Tax Assessment Tax Assessment Total Assessment is a certain percentage of the fair market value that is determined by local assessors to be the total taxable value of land and additions on the property. Land Improvement
2025 $3,140 $158,800 $0 $0
2024 $1,151 $147,700 $0 $0
2023 $1,097 $138,100 $0 $0
2022 $2,849 $120,000 $0 $0
2021 $2,504 $105,400 $0 $0
2020 $2,504 $101,000 $11,300 $89,700
2019 $2,457 $109,200 $0 $0
2018 $2,399 $81,900 $0 $0
2017 $2,350 $88,100 $0 $0
2016 $950 $88,100 $0 $0
2015 -- $87,600 $8,900 $78,700
2014 -- $81,500 $17,100 $64,400
2013 -- $83,800 $0 $0
Source: Public Records

Agents Affiliated with this Home

  • Section Image
See All Agents

Map