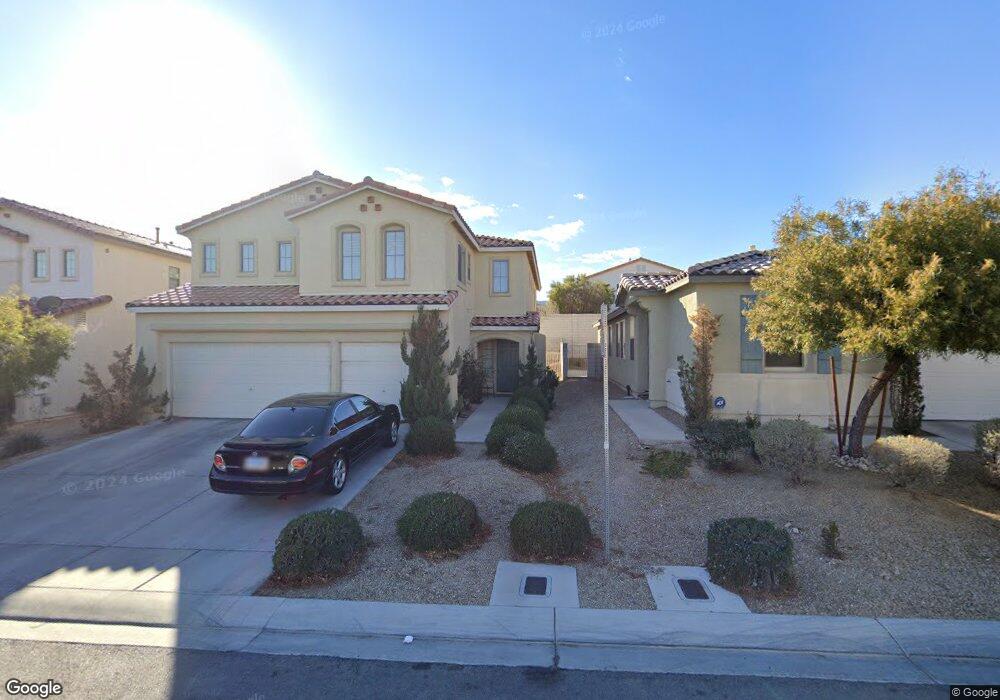
5556 Spruce Hill Ct Las Vegas, NV 89148
Estimated Value: $442,000 - $469,000
3
Beds
2
Baths
1,741
Sq Ft
$262/Sq Ft
Est. Value
About This Home
This home is located at 5556 Spruce Hill Ct, Las Vegas, NV 89148 and is currently estimated at $456,453, approximately $262 per square foot. 5556 Spruce Hill Ct is a home located in Clark County with nearby schools including Kathy L. Batterman Elementary School, Victoria Fertitta Middle School, and Durango High School.
Ownership History
Date
Name
Owned For
Owner Type
Purchase Details
Closed on
Jun 21, 2021
Sold by
Morgan Douglas E and Daphney Irrevocable Trust
Bought by
Dye Wesley and Morgan Whitney
Current Estimated Value
Home Financials for this Owner
Home Financials are based on the most recent Mortgage that was taken out on this home.
Original Mortgage
$330,000
Outstanding Balance
$298,774
Interest Rate
2.9%
Mortgage Type
VA
Estimated Equity
$157,679
Purchase Details
Closed on
Apr 23, 2008
Sold by
Bonanno Bertha
Bought by
Bonanno Bertha and Daphney Irrevocable Trust
Purchase Details
Closed on
Oct 26, 2004
Sold by
Pardee Homes Of Nevada
Bought by
Bonanno Bertha
Home Financials for this Owner
Home Financials are based on the most recent Mortgage that was taken out on this home.
Original Mortgage
$68,400
Interest Rate
4.87%
Create a Home Valuation Report for This Property
The Home Valuation Report is an in-depth analysis detailing your home's value as well as a comparison with similar homes in the area
Home Values in the Area
Average Home Value in this Area
Purchase History
| Date | Buyer | Sale Price | Title Company |
|---|---|---|---|
| Dye Wesley | $330,000 | Chicago Title Las Vegas | |
| Bonanno Bertha | -- | None Available | |
| Bonanno Bertha | $322,411 | Chicago Title |
Source: Public Records
Mortgage History
| Date | Status | Borrower | Loan Amount |
|---|---|---|---|
| Open | Dye Wesley | $330,000 | |
| Previous Owner | Bonanno Bertha | $68,400 |
Source: Public Records
Tax History Compared to Growth
Tax History
| Year | Tax Paid | Tax Assessment Tax Assessment Total Assessment is a certain percentage of the fair market value that is determined by local assessors to be the total taxable value of land and additions on the property. | Land | Improvement |
|---|---|---|---|---|
| 2025 | $2,395 | $129,648 | $49,000 | $80,648 |
| 2024 | $2,338 | $129,648 | $49,000 | $80,648 |
| 2023 | $1,575 | $113,007 | $37,100 | $75,907 |
| 2022 | $2,165 | $103,411 | $34,300 | $69,111 |
| 2021 | $2,005 | $95,466 | $29,750 | $65,716 |
| 2020 | $1,859 | $95,252 | $30,100 | $65,152 |
| 2019 | $1,742 | $91,580 | $27,650 | $63,930 |
| 2018 | $1,662 | $82,858 | $21,350 | $61,508 |
| 2017 | $2,420 | $82,504 | $20,300 | $62,204 |
| 2016 | $1,575 | $71,219 | $16,800 | $54,419 |
| 2015 | $1,571 | $62,885 | $12,950 | $49,935 |
| 2014 | $1,525 | $50,450 | $9,800 | $40,650 |
Source: Public Records
Map
Nearby Homes
- 5526 Spruce Hill Ct
- 5634 Moccasin Point St
- 5674 Moccasin Point St
- 5387 S Conquistador St
- 10026 Indy Rey Ct
- 5349 Misty Acres Ct
- 5736 Remy Rain St
- 9862 Shadow Grove Ave
- 10034 Sir Atlas Ct
- 9750 Maple Sugar Leaf Place
- 5697 Tapestry Rose Ct
- 10138 Chasewood Ave
- 5769 Danish Garden St
- 10241 Premia Place
- 5389 Progresso St
- 5568 Table Top Ln
- 5554 Chicory Falls Ct
- 10273 Aragon Crown Rd
- 10235 Tresor Ct
- 9687 Ridgebluff Ave
- 5546 Spruce Hill Ct
- 5566 Spruce Hill Ct
- 5576 Spruce Hill Ct
- 5536 Spruce Hill Ct
- 5559 Valley Mill St
- 5549 Valley Mill St
- 5569 Valley Mill St
- 5579 Valley Mill St
- 5586 Spruce Hill Ct
- 5539 Valley Mill St
- 5557 Spruce Hill Ct
- 5567 Spruce Hill Ct
- 5547 Spruce Hill Ct
- 5529 Valley Mill St
- 5589 Valley Mill St
- 5577 Spruce Hill Ct
- 5537 Spruce Hill Ct
- 5596 Spruce Hill Ct
- 5516 Spruce Hill Ct
- 5587 Spruce Hill Ct