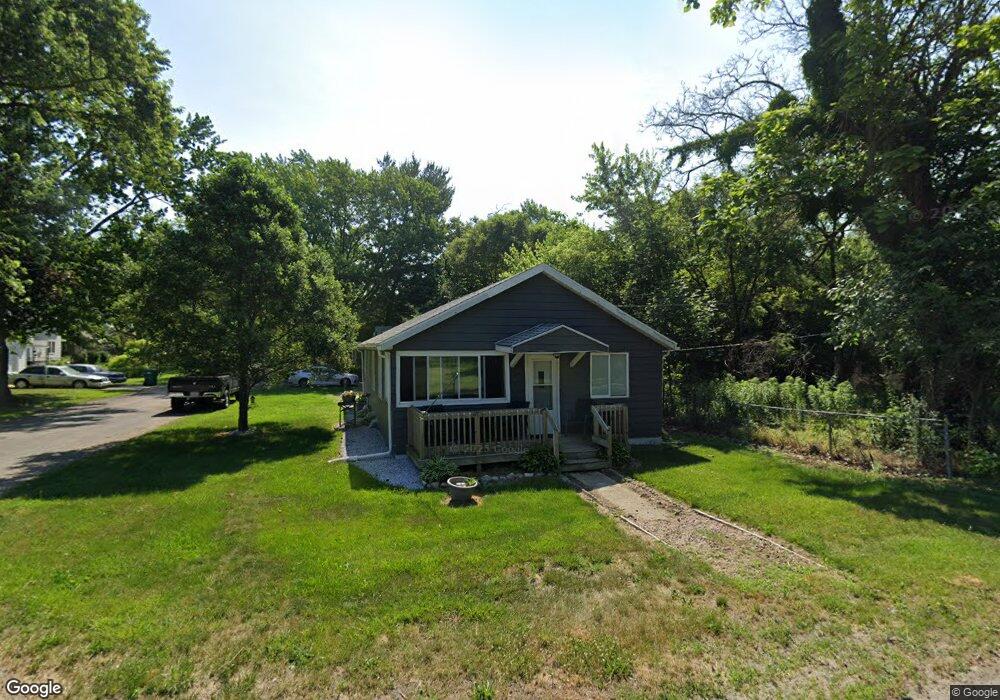
55568 Moss Rd South Bend, IN 46628
Estimated Value: $83,000 - $147,183
2
Beds
1
Bath
1,056
Sq Ft
$118/Sq Ft
Est. Value
About This Home
This home is located at 55568 Moss Rd, South Bend, IN 46628 and is currently estimated at $124,796, approximately $118 per square foot. 55568 Moss Rd is a home located in St. Joseph County with nearby schools including Warren Elementary School, Clay Intermediate Center, and Dickinson Fine Arts Academy.
Ownership History
Date
Name
Owned For
Owner Type
Purchase Details
Closed on
Sep 13, 2021
Sold by
Sego Darin M
Bought by
King Doug L
Current Estimated Value
Home Financials for this Owner
Home Financials are based on the most recent Mortgage that was taken out on this home.
Original Mortgage
$3,675
Interest Rate
2.12%
Purchase Details
Closed on
Sep 9, 2021
Sold by
Kepplin Rosetta O
Bought by
Meridian Title Corporation
Home Financials for this Owner
Home Financials are based on the most recent Mortgage that was taken out on this home.
Original Mortgage
$3,675
Interest Rate
2.12%
Purchase Details
Closed on
Jan 29, 2021
Sold by
Default Krystal
Bought by
Sego Darin M
Purchase Details
Closed on
Oct 27, 2010
Sold by
Kepplin Lynn B
Bought by
Kepplin Kevin E
Purchase Details
Closed on
Oct 13, 2001
Sold by
Kepplin Rosetta
Bought by
The Rosetta O Kepplin Revocable Living T
Create a Home Valuation Report for This Property
The Home Valuation Report is an in-depth analysis detailing your home's value as well as a comparison with similar homes in the area
Home Values in the Area
Average Home Value in this Area
Purchase History
| Date | Buyer | Sale Price | Title Company |
|---|---|---|---|
| King Doug L | $105,000 | None Available | |
| Meridian Title Corporation | -- | -- | |
| Sego Darin M | $13,200 | None Available | |
| Kepplin Kevin E | -- | None Available | |
| The Rosetta O Kepplin Revocable Living T | -- | None Available |
Source: Public Records
Mortgage History
| Date | Status | Borrower | Loan Amount |
|---|---|---|---|
| Closed | King Doug L | $3,675 | |
| Open | King Doug L | $103,098 |
Source: Public Records
Tax History Compared to Growth
Tax History
| Year | Tax Paid | Tax Assessment Tax Assessment Total Assessment is a certain percentage of the fair market value that is determined by local assessors to be the total taxable value of land and additions on the property. | Land | Improvement |
|---|---|---|---|---|
| 2024 | $446 | $73,900 | $5,000 | $68,900 |
| 2023 | $389 | $71,400 | $5,100 | $66,300 |
| 2022 | $432 | $62,300 | $5,100 | $57,200 |
| 2021 | $407 | $52,000 | $6,900 | $45,100 |
| 2020 | $1,168 | $46,900 | $6,200 | $40,700 |
| 2019 | $1,077 | $47,600 | $6,300 | $41,300 |
| 2018 | $82 | $43,700 | $5,700 | $38,000 |
| 2017 | $39 | $35,900 | $4,800 | $31,100 |
| 2016 | $105 | $35,900 | $4,800 | $31,100 |
| 2014 | $307 | $45,900 | $4,800 | $41,100 |
Source: Public Records
Map
Nearby Homes
- 22814 Ardmore Trail
- 55310 Moss Rd
- 55525 Fairview Ave
- 5113 Packard Ave
- 421 N Grandview Ave
- 4629 Linden Ave
- 55175 Moss Rd
- 1112 Canterbury Dr
- 213 Concord Ave
- 3913 Ardmore Trail
- TBD Linden Ave
- 3903 Roxebury Plaza
- 1251 Sussex Dr
- 23560 Fillmore Rd
- 55345 Hollywood Blvd
- 3721 Surrey Ln
- 127 S Gladstone St
- 3929 Lincoln Way W
- 210 N Illinois St
- 261 N Kenmore St
- 55576 Moss Rd
- 55584 Moss Rd
- 55556 Moss Rd
- 55590 Moss Rd
- 55575 Kensington Ave
- 55585 Kensington Ave
- 55536 Moss Rd
- 55545 Kensington Ave
- 55589 Moss Rd
- 55605 Kensington Ave
- 55535 Kensington Ave
- 55590 Kensington Ave
- 55555 Moss Rd
- 23112 Ardmore Trail
- 23122 Ardmore Trail
- 23100 Ardmore Trail
- 55615 Moss Rd
- 55576 Kensington Ave
- 55610 Melrose Ave
- 55558 Melrose Ave