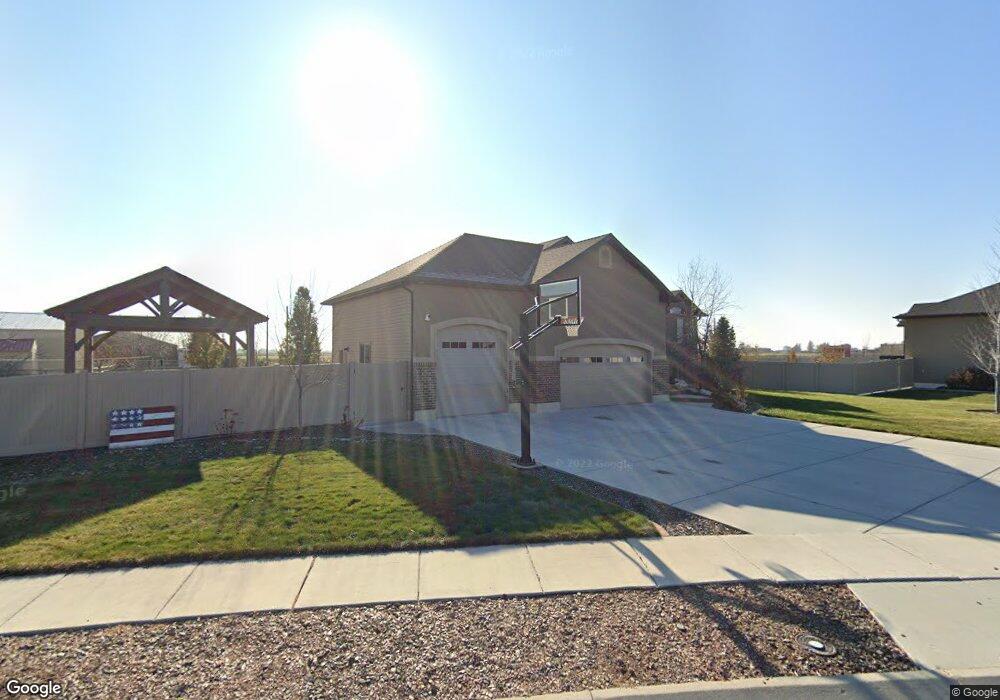
5557 W 5725 S Unit 22 Hooper, UT 84315
Estimated Value: $643,555 - $687,000
5
Beds
3
Baths
1,813
Sq Ft
$369/Sq Ft
Est. Value
About This Home
This home is located at 5557 W 5725 S Unit 22, Hooper, UT 84315 and is currently estimated at $668,889, approximately $368 per square foot. 5557 W 5725 S Unit 22 is a home located in Weber County with nearby schools including Hooper Elementary School, Rocky Mountain Junior High School, and Fremont High School.
Ownership History
Date
Name
Owned For
Owner Type
Purchase Details
Closed on
Mar 22, 2013
Sold by
Bell Built Homes Inc
Bought by
Tew Darin and Tew Heather
Current Estimated Value
Home Financials for this Owner
Home Financials are based on the most recent Mortgage that was taken out on this home.
Original Mortgage
$204,000
Outstanding Balance
$143,631
Interest Rate
3.49%
Mortgage Type
New Conventional
Estimated Equity
$525,258
Purchase Details
Closed on
Aug 28, 2012
Sold by
Karras Alan
Bought by
Bell Built Homes Inc
Home Financials for this Owner
Home Financials are based on the most recent Mortgage that was taken out on this home.
Original Mortgage
$219,300
Interest Rate
3.59%
Mortgage Type
Construction
Purchase Details
Closed on
Dec 13, 2010
Sold by
Lakeview Farms 1 Llc
Bought by
Karras Alan
Purchase Details
Closed on
Apr 29, 2010
Sold by
Hh21 Llc
Bought by
Lakeview Farms 1 Llc
Purchase Details
Closed on
Mar 12, 2010
Sold by
Cedar Crest Development Inc
Bought by
Hh21 Llc
Create a Home Valuation Report for This Property
The Home Valuation Report is an in-depth analysis detailing your home's value as well as a comparison with similar homes in the area
Home Values in the Area
Average Home Value in this Area
Purchase History
| Date | Buyer | Sale Price | Title Company |
|---|---|---|---|
| Tew Darin | -- | Mountain View Title Ogden | |
| Bell Built Homes Inc | -- | Mountain View Title | |
| Karras Alan | -- | Accommodation | |
| Lakeview Farms 1 Llc | -- | Mountain View Title Ogden | |
| Hh21 Llc | -- | Cottonwood Title Insurance A |
Source: Public Records
Mortgage History
| Date | Status | Borrower | Loan Amount |
|---|---|---|---|
| Open | Tew Darin | $204,000 | |
| Previous Owner | Bell Built Homes Inc | $219,300 |
Source: Public Records
Tax History Compared to Growth
Tax History
| Year | Tax Paid | Tax Assessment Tax Assessment Total Assessment is a certain percentage of the fair market value that is determined by local assessors to be the total taxable value of land and additions on the property. | Land | Improvement |
|---|---|---|---|---|
| 2025 | $3,559 | $620,642 | $220,941 | $399,701 |
| 2024 | $3,430 | $609,000 | $220,941 | $388,059 |
| 2023 | $3,705 | $652,000 | $220,682 | $431,318 |
| 2022 | $3,406 | $613,000 | $170,622 | $442,378 |
| 2021 | $2,991 | $499,000 | $105,408 | $393,592 |
| 2020 | $2,950 | $451,000 | $85,391 | $365,609 |
| 2019 | $2,691 | $389,000 | $80,363 | $308,637 |
| 2018 | $2,706 | $374,000 | $75,377 | $298,623 |
| 2017 | $2,495 | $334,000 | $53,320 | $280,680 |
| 2016 | $2,296 | $165,977 | $29,042 | $136,935 |
| 2015 | $2,198 | $156,539 | $29,042 | $127,497 |
| 2014 | $2,107 | $146,019 | $29,042 | $116,977 |
Source: Public Records
Map
Nearby Homes
- 5335 W 5500 S
- 0 W 5500 S
- 3632 S 5400 W
- 4909 W 5850 S
- 6014 W 5300 S
- 2462 N Hooded Crane Ct
- 2444 N Hooded Crane Cir Unit 11
- 2084 N 4500 W
- 4700 W 5500 S
- 4632 W 5750 S
- 4879 S 5050 W
- Torino Farmhouse Plan at Cranefield Estates
- 1700 Farmhouse Plan at Cranefield Estates - Estates Collection
- 2000 Traditional Plan at Cranefield Estates - Estates Collection
- Murano Traditional Plan at Cranefield Estates - Estates Collection
- 2400 Farmhouse Plan at Cranefield Estates - Estates Collection
- 1825 Traditional Plan at Cranefield Estates - Estates Collection
- 1550 Craftsman Plan at Cranefield Estates - Estates Collection
- 2050 Craftsman Plan at Cranefield Estates - Estates Collection
- Murano Traditional Plan at Cranefield Estates
- 5557 W 5725 S
- 5571 W 5725 S
- 5571 W 5725 S Unit 21
- 5779 S 5500 W
- 5532 W 5725 S Unit 2
- 5532 W 5725 S
- 5589 W 5725 S
- 5589 W 5725 S Unit 20
- 5564 W 5725 S Unit 4
- 5548 W 5725 S
- 5548 W 5725 S Unit 4
- 5548 W 5725 S Unit 3
- 5516 W 5725 S Unit 1
- 5516 W 5725 S
- 5605 W 5725 S
- 5605 W 5725 S Unit 19
- 5582 W 5725 S Unit 5
- 5582 W 5725 S
- 5753 S 5500 W
- 5116 W 5725 S Unit 12